Contact Us
Subscribe to Causeway Insights, delivered to your inbox.
Generally, the best value stocks carry the heavy weight of investor skepticism. Perhaps nowhere is this burden more evident today than in the global energy sector. Causeway shares our fundamental approach to valuing stocks in this cyclical sector, and why we believe the energy industry offers the potential for improved profitability from operating efficiencies, enhanced by a modestly rising crude oil price.
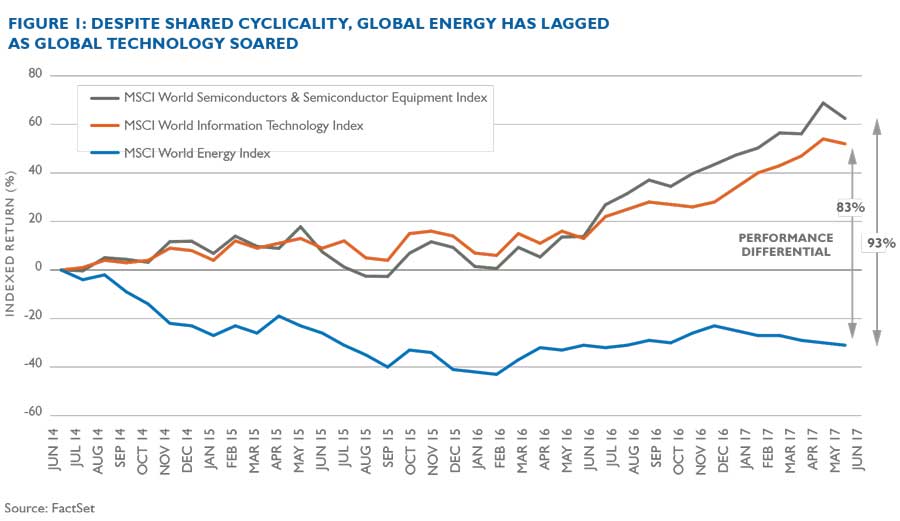
Energy companies exhibit cyclicality in their revenue growth and earnings, traits that investors have shunned in recent years in favor of steady, reliable growth. Relative to high-flying information technology sector stocks, including semiconductor and semiconductor equipment manufacturers, the recent performance of energy equities looks particularly abysmal. As an aside, we caution that the last time markets ignored the cyclicality of technology was in the late 1990s.
Of course, cyclicality is not only to blame for investors’ current distaste for energy stocks. Investors may be worried about a global glut of crude oil, especially from rising US shale oil production. Pessimists refer to the seemingly endless improvement in US shale productivity (as marginal costs fall, producers can boost wells and drilling), and possible lack of OPEC production volume discipline as reasons to abandon energy stocks. Furthermore, they argue that weak demand from Europe for refined product drags down the global demand outlook. Longer term, investors may also harbor fears of substitution effects from a proliferation of electric vehicles. Despite the naysayers, we currently see a promising trajectory for oil & gas prices based on our research in the sector. In Causeway’s view, the energy industry offers the potential for improved profitability from operating efficiencies, enhanced by a modestly rising crude oil price.
Many economically cyclical value stocks appear on Causeway’s weekly screens when their revenue growth slows or shrinks, profit margins narrow, and their returns on capital decline. For illustration, we have included Causeway’s fundamentals curve. Our job is to seek to understand where companies are on that curve. With that information, we can make buy or sell decisions.
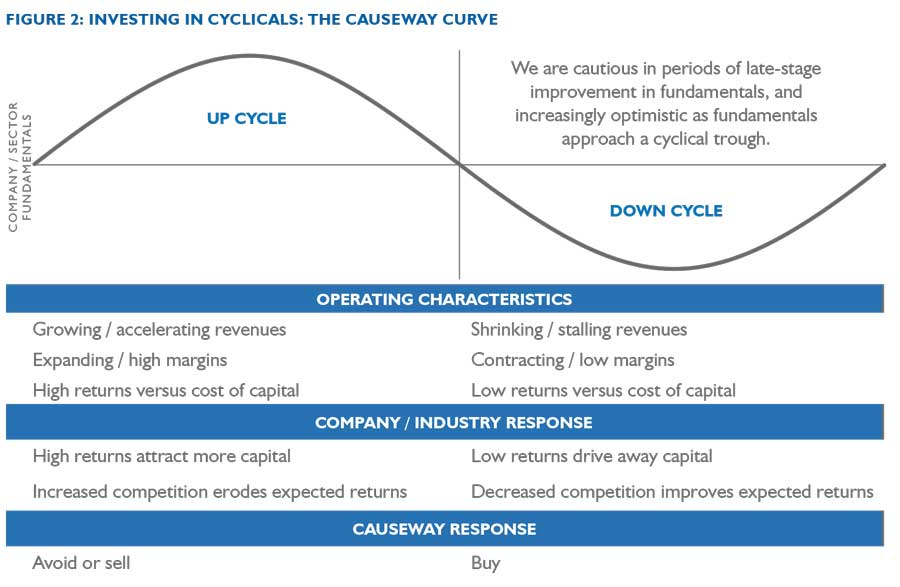
At the top of the curve, companies typically grow revenues, expand profit margins to peak levels, and generate returns on capital well in excess of the cost of that capital. Those appealing returns attract more investment and thus more competition, eroding returns for the industry and pushing companies down the curve. Conversely, as low returns drive companies and capital out of the business, returns for the remaining participants improve. As fundamental analysts, the more accurate our estimate of a cyclical stock’s location on this curve, the less time, in general, our clients will likely need to wait for a stock’s performance to improve. For portfolio candidates, we fundamentally derive the stocks’ target prices using a two-year time horizon. We want to invest near the trough of the curve, so our clients reap the benefits of the recovery over that period.
To illustrate this analysis, we highlight a sample US oil & gas company that we will call E&P Co. An efficient and independent exploration & production company, E&P Co. has core holdings in the Permian Basin region of West Texas known as the Midland Basin as well as the Eagle Ford Shale. Where is E&P Co.—and where are many other high quality oil & gas producers—on the Causeway Curve? As a research team, we must convince ourselves that fundamentals should improve within the next twelve months for E&P Co.
Rather than measure productivity per well, we believe the right metric is productivity per dollar.
Relative to a conventional oil well, the output of a US shale oil well declines fairly rapidly, typically within the first year of production. According to the International Energy Agency (“IEA”), global oil discoveries fell to a record low in 2016, as companies continued to curtail exploration spending and sanctioned conventional oil projects were at the lowest levels in more than 70 years. Assuming global demand grows 1.3 million barrels per day (mmbpd) in the next five years, the IEA has warned that “an extended period of sharply lower oil investment could lead to a tightening in supplies.” While US shale production speeds up, we believe this is more than offset by the slow pace of growth elsewhere in the global oil sector. According to energy consultant IHS Markit, US production growth of 1 mmbpd in 2018 would require capital expenditures of over twice that of aggregate US industry cash flow, assuming a crude oil price of $45 per barrel (West Texas Intermediate). Rather than measure productivity per well, we believe the right metric is productivity per dollar. Much of the improvement in production growth has been driven by technology improvements, all of which raise costs.
Despite evidence of increased exploration and production costs, some parts of the Permian Basin are so prolific that the marginal cost of production keeps declining, with no floor in sight. The greater the decreases in these costs, the more production we should expect. However, we have sufficient evidence to convince ourselves that oil services costs are rising, and energy company managements complain about price increases in pressure pumping, sand, rail, trucking and labor, to name only a few service categories. Increased cost with no increase in the commodity price lowers profitability, a harbinger of declining production.
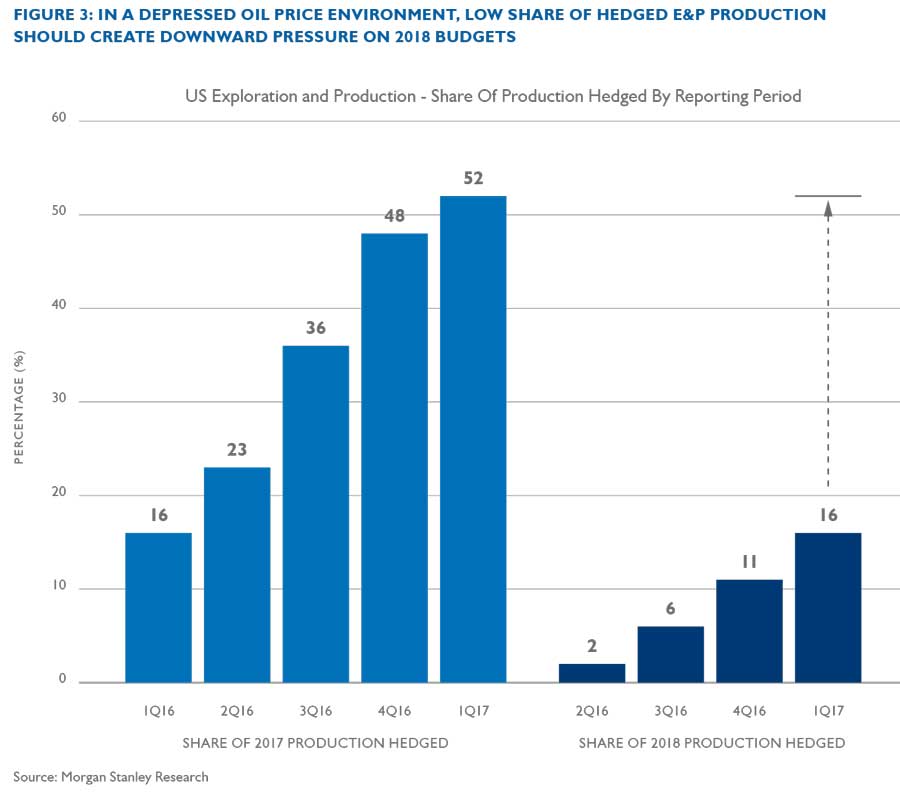
Does this profit squeeze matter if the oil & gas companies can rely on hedges? Without hedges, a low oil price can devastate revenues and cash flows. As an additional constraint, US exploration and production companies have, on average, less than 20% of 2018 production hedged, thus adding to the likely downward pressure on their 2018 budgets, unless oil prices recover significantly before the end of 2017. Our example, E&P Co., has slightly more of its production hedged than the industry average.
Despite the availability of debt and equity capital in the recent downturn, capital expenditures are still constrained by the level of cash flow—the capital markets alone cannot sustain the current trajectory in rig growth or well growth. E&P Co., like its peers, must avoid outspending its cash flows, a natural constraint to growth in capital expenditures in rigs and wells.
The metrics for E&P Co. place it in the declining returns segment of the Causeway Curve. But how do we estimate when revenue growth should improve, margins expand and returns on capital recover? We analyze E&P Co.’s management skill, its corporate strategy, and its oil versus gas mix, and seek to determine how much optimism – or pessimism – is embedded in the stock price. After sagging year to date, we believe E&P Co.’s share price incorporates negligible good news.
We expect that the pain inflicted on the entire energy sector from low commodity prices should constrain investment and supply.
We are convinced the company’s productive acreage and experienced management, plus cheap valuation, makes this an above-average investment candidate. The company has a high crude oil beta, meaning that the company’s stock price moves dramatically with changes in oil & gas prices. Summing all the values of its various oil & gas properties, less its net debt, we believe E&P Co. trades at a near 50% discount to its fair value, assuming that next year’s crude oil price responds to supply constraints. We expect that the pain inflicted on the entire energy sector from low commodity prices should constrain investment and supply. If, as we expect, crude oil prices recover – perhaps approaching $60 per barrel and natural gas reaching $3.25 per thousand cubic feet—we believe that stocks such as E&P Co. will move quickly up the Causeway Curve.
Important Disclosures
This market commentary expresses Causeway’s views as of July 10, 2017 and should not be relied on as research or investment advice regarding any investment. These views and any portfolio holdings and characteristics are subject to change, and there is no guarantee that any forecasts made will come to pass. Any securities referenced do not represent all of the securities purchased, sold or recommended by Causeway. The reader should not assume that an investment in any securities referenced was or will be profitable. Forecasts are subject to numerous assumptions, risks and uncertainties, which change over time, and Causeway undertakes no duty to update any such forecasts. Information and data presented has been developed internally and/or obtained from sources believed to be reliable; however, Causeway does not guarantee the accuracy, adequacy or completeness of such information.
The MSCI World Energy Index is designed to capture the large and mid cap segments across 23 developed markets countries. All securities in the index are classified in the Energy sector as per the Global Industry Classification Standard (GICS®). The MSCI World Information Technology Index is designed to capture the large and mid cap segments across 23 developed markets countries. All securities in the index are classified in the Information Technology sector as per the Global Industry Classification Standard (GICS®). The MSCI World Semiconductors & Semiconductor Equipment Index is designed to capture the large and mid cap segments across 23 developed markets countries. All securities in the index are classified in the Semiconductors & Semiconductor Equipment industry group as per the Global Industry Classification Standards (GICS®). The Indices are gross of withholding taxes, assume reinvestment of dividends and capital gains, and assume no management, custody, transaction or other expenses. It is not possible to invest directly in these indices.
MSCI has not approved, reviewed or produced this report, makes no express or implied warranties or representations and is not liable whatsoever for any data in the report. You may not redistribute the MSCI data or use it as a basis for other indices or investment products.
accuracy, adequacy or completeness of such information.