Contact Us
Subscribe to Causeway Insights, delivered to your inbox.
Within a market-neutral strategy, combining long and short alpha streams with low or negative correlations will reduce portfolio volatility and improve risk-adjusted returns. Many long/short and market-neutral funds, however, do not separately report return streams for their long and short portfolios. Separate reporting would reveal a significant weakness inherent in most long/short strategies: the positive correlation between the long and short sides of the portfolio. Most managers use similar investment processes to select long and short portfolio positions. We argue that a strategy which combines fundamental and quantitative processes delivers uncorrelated (and often negatively-correlated) sources of alpha. This diversified portfolio construction provides greater potential for downside protection than typical long/short and market-neutral funds.
In a previous Causeway research paper, we discussed a method to determine the value added from both long and short sides of a long/short portfolio. Calculating alpha is straightforward in a long-only equity portfolio: Assuming a beta of 1, the long alpha is simply the return of the long portfolio in excess of the relevant benchmark. The calculation may appear more difficult when considering a long/short portfolio. However, selecting an appropriate “pseudo-benchmark” ( as a dividing line between the long and short sides facilitates this calculation. With the pseudo benchmark, the long alpha is the outperformance of the long side relative to the benchmark, and the short-side is the relative underperformance vis-à-vis the same benchmark:

Combining these terms and allowing for leverage and/or differing gross exposures on the long and short portfolios (represented by variable g), we arrive at:
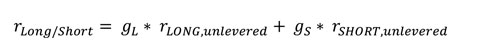
Or, stated in terms of alphas:

When we narrow our focus from long/short funds to market-neutral strategies (meaning a strategy with zero net exposure), we assume that the long and short gross exposures are equal (or very close), and so the last term drops out to give us:
![]()
![]()
The equation above demonstrates that in order to maximize total return/alpha, both long and short sides should contribute positive alphas. But what about the net volatility of the combined alpha stream? While adding the long and short alphas is relatively simple, adding the variances or volatilities (represented by δ) is slightly more complicated because it incorporates an interaction term between the long and the short alphas. This equation again assumes the gross exposure of the long side equals the gross exposure of the short side:
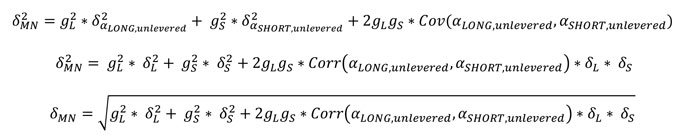
Or, stated more simply:
![]()
![]()
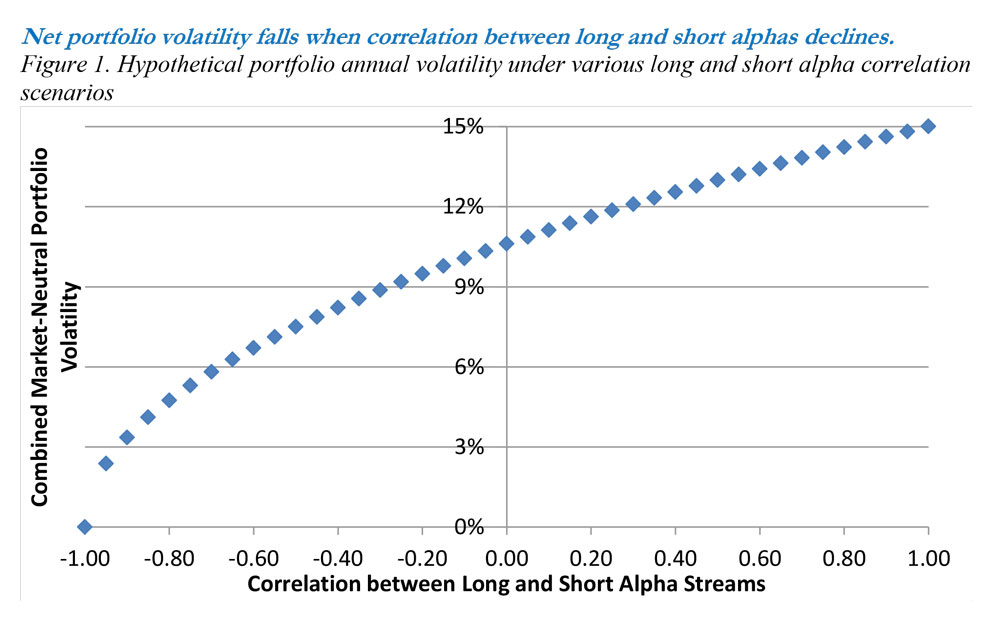
As a result, the correlation term between long and short alphas is a major driver of combined volatility. The less correlated the alphas, the greater the benefit in volatility reduction. To demonstrate this effect, let’s assume a hypothetical portfolio that produces 2.0% of unlevered alpha annually on both the long and short sides. This portfolio then levers both sides to 150% gross exposure, thereby generating a 6% annual alpha. Let’s further assume the annualized volatility of each side’s unlevered alpha stream is 5%. If the correlation between the alpha streams is 1 – that is, both sides produce proportional alphas at the same points in time – and we lever both sides to 150%, combined volatility will equal the sum of each side’s volatility weighted by 1.5, or 15% total volatility. As correlation between the long and short alpha streams falls, we see a reduction in combined volatility (illustrated in Figure 1) because each side adds alpha at decreasingly coincidental times. The net result is a smoother alpha stream.
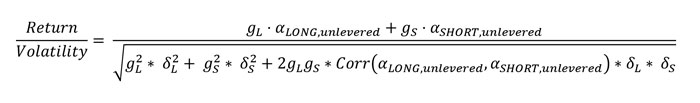
Since market-neutral strategies are generally low-volatility strategies, this volatility reduction effect is very important in maximizing the Sharpe ratio or other risk-adjusted measures of return:
To illustrate this effect, let’s continue with the example for the hypothetical portfolio described above and assume that alpha generation is constant regardless of the level of correlation. That is, both sides produce 2% unlevered alpha each year, but we vary the correlation between the alpha streams in Figure 2.
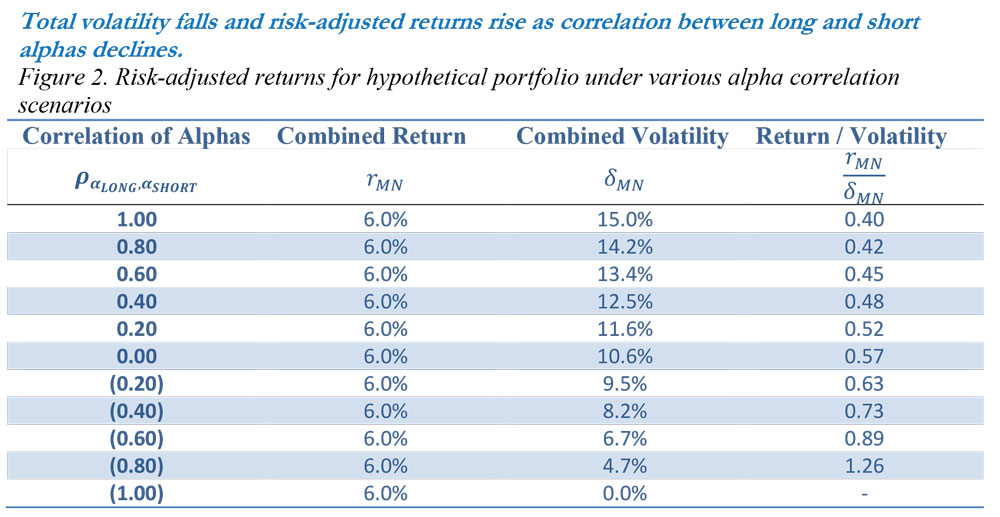
Though the combined returns are identical, the way they are achieved is quite different. The risk-adjusted return ratio improves by 43% moving from a 1.0 correlation between long and short alphas down to 0. With the move into negatively-correlated alphas, the two sides add value at predominantly non-overlapping points in time. In most observations, the long side contributes positive alpha when the short side loses, and vice versa.
Of course, the “perfect” strategy would add (positive) alphas on both long and short sides every month. But in the absence of this crystal ball strategy, negatively-correlated alphas will produce superior risk-adjusted returns. However, negatively-correlated alphas are a rare feature to find. Most long/short and market-neutral funds not only use the same investment team to select long and short positions, but they also use similar factors on the long and short sides. For instance, they may focus exclusively on valuation, and will seek to buy (long) cheap stocks and short expensive stocks. The problem with this alignment is that in periods when value does not lead to market outperformance, alpha generation will fail on both sides of the portfolio at the same time. This leads to a portfolio with high correlation between long and short alphas, higher portfolio-level volatility, and greater drawdowns.
The vast majority of managers do not separately report the performance of the long and short sides of their portfolio. This complicates the search for long/short or market-neutral managers with low or negatively-correlated alphas. Without the detail, it is virtually impossible to infer the relative value added from each side of the portfolio or the correlation between long and short alphas. Managers may balk at this detailed disclosure for confidentiality reasons. We argue, however that disclosing short-side returns is certainly less revealing than disclosing short-side positions. We suspect that many long/short and market-neutral managers do not add value on the short side and do not want to reveal that particular aspect of their performance.
More theoretically, however, how can a market-neutral fund manager design a strategy that has low or negatively-correlated alpha streams? Having different teams, different processes, and a different set of investment criteria with different time horizons on each side will help. For example, given the inherent differences between fundamental and quantitative research, this could be achieved by dividing the long and short sides between fundamental and quantitative approaches. Stock selection through fundamental analysis will have the greatest potential for outperformance when dispersion among stock returns is high, such that choosing one stock over another produces a greater return differential. In contrast, quantitative analysis has the best potential to outperform in periods when dispersion in factor returns is high, signifying a broader opportunity set from a quantitative stock ranking process.
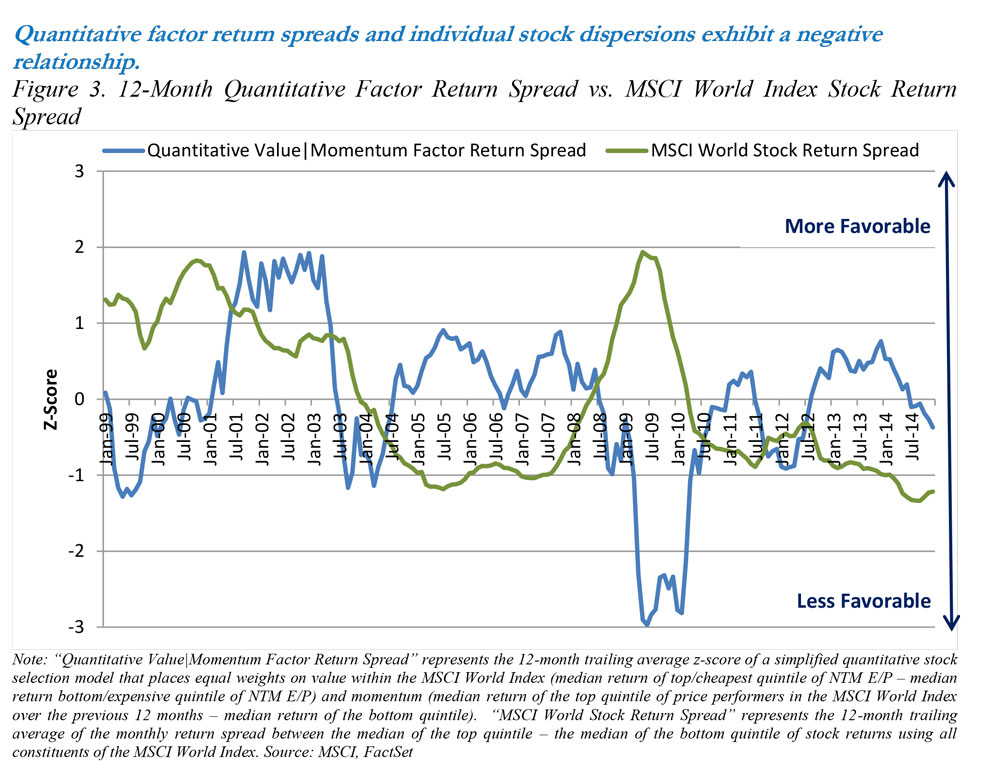
To examine this issue more closely, we compared the return spreads from certain quantitative factors to the return spreads among individual stocks (see Figure 3). We constructed a simple quantitative ranking model − 50% value (earnings yield) and 50% 12-month price momentum – and recorded inter-quintile return spreads over time (plotted in blue). Separately, we tracked inter-quintile return spreads between all stocks in the MSCI World Index (plotted in green). Figure 3 shows both metrics, standardized, over time. For both factor return spreads (favoring quantitative analysis) and stock return spreads (favoring fundamental analysis), higher values correspond to superior environments. One can see that conditions beneficial to fundamental vs. quantitative analysis generally occur at different times.
Actual fund returns confirm this observation. One of the few academic papers that compares fundamentally-managed mutual funds to quantitatively-managed mutual funds found that “quants” outperformed their fundamental peers by an average of 35 bps during “bear” months (in which the S&P 500 Index lost more than 2%), but underperformed by an average of 22 bps in “bull” months (where the S&P 500 Index rose more than 2%) between 1994-2003 within U.S. equity mutual funds.[1] The paper suggests that a more sophisticated approach to risk control among quants is one reason for this finding.
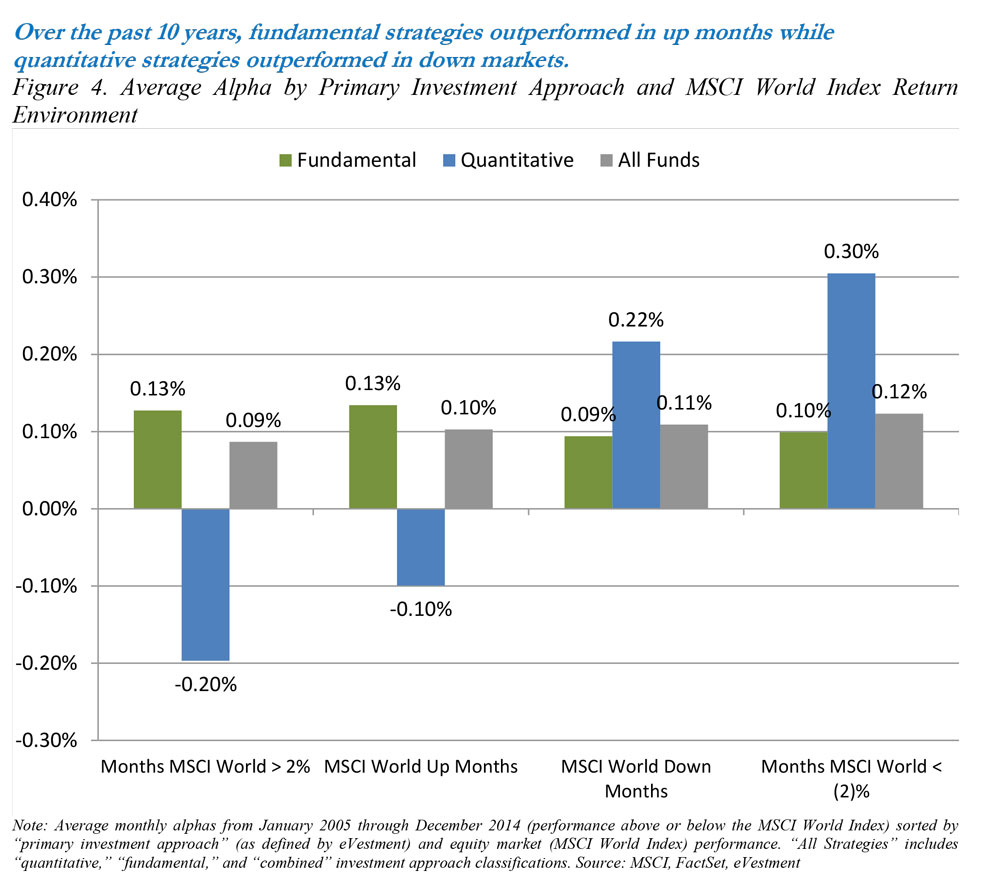
We replicated this analysis for the universe of global equity strategies over the past 10 years (ended March 2014) and observed a similar pattern. Using eVestment’s “Primary Investment Approach” classification, we sorted all global equity separate account strategies (survivorship bias-free), into “fundamental,” “quantitative,” and “other” categories and then observed average monthly alphas (performance in excess of the MSCI World Index) by category. In Figure 4, we plotted average monthly alphas in up and down months as well as in “extreme” up and down months, that is months in which the MSCI World Index gained >2% or lost <(2)%. Again, we observe that the fundamental – quantitative performance spread is greatest in months when the MSCI World Index is up and most negative (i.e., quant outperforms fundamental by the greatest margin) in down months.
Conclusion
Investors will gain more insight into long/short and market-neutral funds by analyzing long and short alphas separately. The ideal fund will generate positive alpha on both the long and short sides, and these alphas should have low or negative correlations with each other to smooth returns and lower combined portfolio volatility. A combination of fundamental and quantitative alpha streams can accomplish this objective.
[1] Jane Zhao, “Quant Jocks and Tire Kickers: Does the Stock Selection Process Matter?” (PhD diss., University of Arizona, 2006).
Sources Cited
Zhao, Jane. “Quant Jocks and Tire Kickers: Does the Stock Selection Process Matter?” PhD diss., University of Arizona, 2006.
Solely for the use of institutional investors and professional advisers.
This presentation expresses the authors’ views as of March 3, 2015 and should not be relied on as research or investment advice regarding any investment. These views and any portfolio characteristics are subject to change. There is no guarantee that any forecasts made will come to pass.
“Alpha” is a measurement of performance return in excess of a benchmark index.
“Beta” is a measurement of sensitivity to the benchmark index. A beta of 1 indicates that a portfolio’s value will move in line with the index. A beta of less than 1 means that the portfolio will be less volatile than the index; a beta of greater than 1 indicates that the security’s price will be more volatile than the index.
“Correlation” ranges between -1 and +1. Perfect positive correlation (+1) implies that as the index moves up or down, the strategy will move in the same direction. Perfect negative correlation (-1) means the strategy will move in the opposite direction. A correlation of 0 means the index and strategy have no correlation.
“Covariance” is a measure of the degree to which returns on two risky assets move in tandem. Covariance is equal to the mean value of the product of the deviations of two variables from their respective means. A positive covariance means that asset returns move together. A negative covariance means returns move inversely.
“NTM E/P” is next-twelve-months earnings-to-price ratio.
“Sharpe ratio” is a measure of risk-adjusted performance that divides the average return minus the risk-free return by the standard deviation of those excess returns (returns above the risk-free return).
“Volatility” is the standard deviation of returns.
“z-score” is a standardized score that indicates how many standard deviations a data point is from the mean. A z-score of 0 means the score is the same as the mean. A z-score can also be positive or negative, indicating whether it is above or below the mean and by how many standard deviations.
The MSCI World Index is a free float-adjusted market capitalization index, designed to measure developed market equity performance, consisting of 23 developed country indices, including the U.S. The Index is gross of withholding taxes, assumes reinvestment of dividends and capital gains, and assumes no management, custody, transaction or other expenses. It is not possible to invest directly in an Index.
MSCI has not approved, reviewed or produced this report, makes no express or implied warranties or representations and is not liable whatsoever for any data in the report. You may not redistribute the MSCI data or use it as a basis for other indices or investment products.