Contact Us
Subscribe to Causeway Insights, delivered to your inbox.
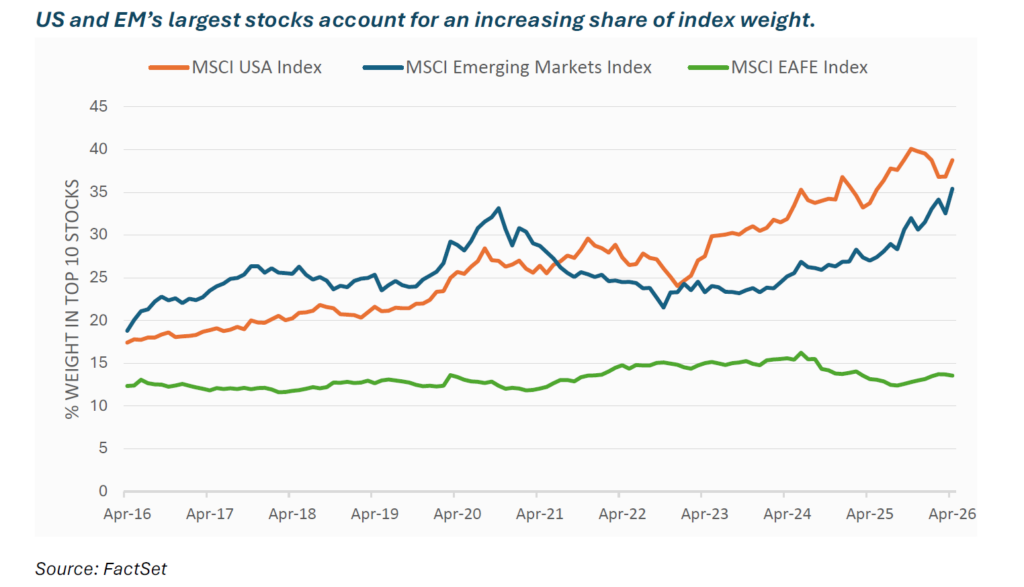
A narrow group of companies is driving global equity market returns. In the US, the top ten stocks now account for nearly 40% of the MSCI USA Index, surpassing peaks reached during the dot-com era. That concentration may increase further if highly valued companies such as SpaceX, Anthropic, and OpenAI enter public equity indices through IPOs. Emerging markets have experienced a similar dynamic. The “Big Three” emerging markets technology companies—TSMC, Samsung Electronics, SK Hynix—now represent 30% of the MSCI Emerging Markets Index. As index concentrations rise, investors should examine valuations, earnings durability, and breadth of opportunity.
Key insights
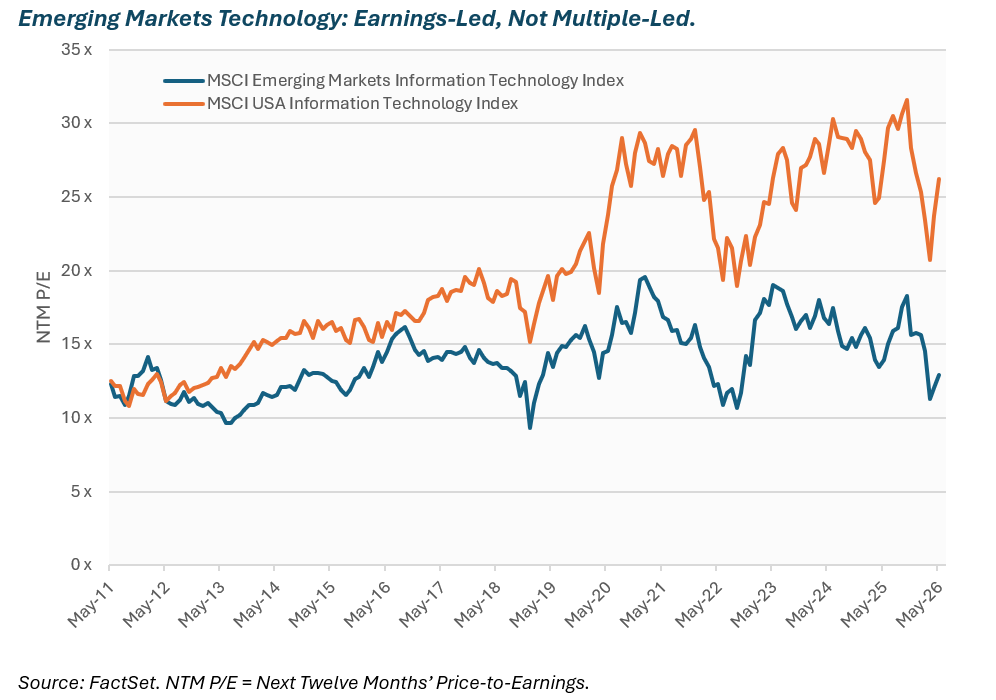
- Unlike in the US, Emerging Markets IT earnings expectations have largely kept pace with rising share prices
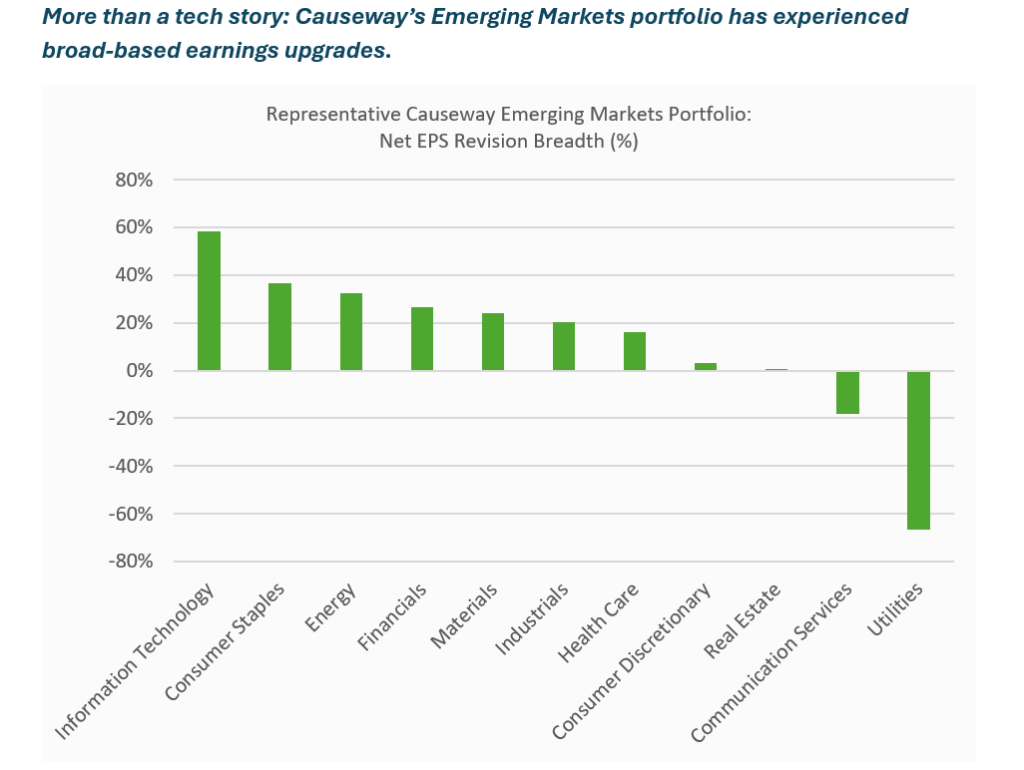
- Emerging Markets earnings growth extends beyond the “Big Three,” with momentum across sectors and countries.
- Emerging Markets continues to offer diversification benefits, with correlations below long-term averages.
By Ryan Myers
While rising index concentration reflects structural competitive advantages in both EM and the US, US valuations no longer provide a margin of safety relative to their EM counterparts. Moreover, index concentration obscures the breadth of earnings opportunities available across emerging markets, creating, in our view, a rich opportunity set for active investors.
Information technology stocks—particularly semiconductor stocks—are driving concentration in emerging markets, but unlike in the US, earnings expectations have largely kept pace with rising share prices. On a forward price-to-earnings basis, the MSCI Emerging Markets Information Technology Index trades at half the valuation of its US counterpart. Part of this valuation gap reflects differences in business mix, cyclicality, and geopolitical risk. Yet these structural factors do not fully explain the magnitude of today’s discount. Despite recent rallies in emerging markets technology stocks, the index’s forward P/E multiple is essentially unchanged from fifteen years ago. By contrast, the forward P/E of the MSCI USA Information Technology Index has risen substantially, suggesting multiple expansion.
According to Bloomberg consensus estimates, the Emerging Markets “Big Three” are expected to deliver a float-weighted average of 298% year-over-year earnings growth in 2026. This growth is underpinned by continued US hyperscaler capital expenditure—Causeway information technology analysts estimate $750bn in 2026 and $1.1 trillion in 2027—and sustained AI-related demand. In what is increasingly viewed as a “winner-take-most” environment, market leadership has become highly concentrated, and these companies have emerged as beneficiaries of that dynamic.
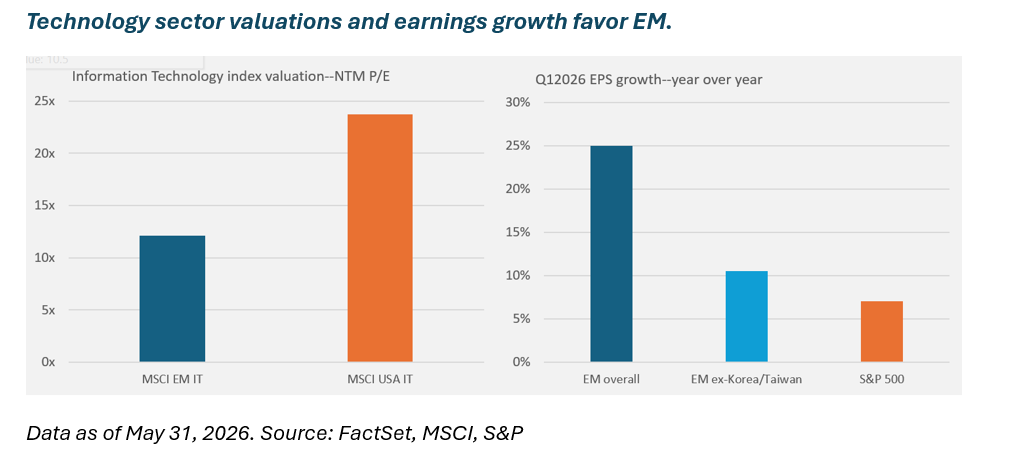
But earnings growth in emerging markets is being driven by more than hyperscaler capex. In the first quarter of 2026, emerging markets excluding South Korea and Taiwan—where the major semiconductor manufacturers are listed—delivered 10.5% year-over-year earnings-per-share (EPS) growth, well ahead of the S&P 500. Bloomberg consensus expectations call for MSCI Emerging Markets Index earnings to grow 54% year-over-year in 2026, double the 27% growth expected for the S&P 500.
Emerging markets also provide exposure to power infrastructure, global defense, energy and materials (including oil, coal, and gold), and a growing middle class, often at valuations that remain attractive relative to US peers.
This breadth of opportunity is reflected in the Causeway Emerging Markets portfolio, where earnings growth extends across a wider range of companies and sectors than the MSCI Emerging Markets Index. Most sector exposures have seen double-digit EPS estimate upgrades over the past three months. Our multi-factor alpha model explicitly favors companies experiencing positive earnings revisions, and today’s emerging markets environment provides a broad opportunity set across sectors.
As market concentration rises, investors also want to know if the asset class can still provide meaningful diversification. Data suggests, yes. Recent correlations of the MSCI Emerging Markets Index with the MSCI USA Index are lower than long-term correlations: The three-year correlation is 0.65, notably below the 0.72 correlation observed over the past thirty years. If anything, we believe the diversification benefits of EM may be stronger today than they have been historically.
Market leadership may be narrow, but the opportunities need not be.
This market commentary expresses Causeway’s views as of June 2026 and should not be relied on as research or investment advice regarding any stock. These views and any portfolio holdings and characteristics are subject to change. There is no guarantee that any forecasts made will come to pass. Forecasts are subject to numerous assumptions, risks, and uncertainties, which change over time, and Causeway undertakes no duty to update any such forecasts. Information and data presented has been developed internally and/or obtained from sources believed to be reliable; however, Causeway does not guarantee the accuracy, adequacy, or completeness of such information.
The views herein represent an assessment of companies at a specific time and are subject to change. There is no guarantee that any forecast made will come to pass. This information should not be relied on as investment advice and is not a recommendation to buy or sell any security. The securities identified and described do not represent all of the securities purchased, sold, or recommended for client accounts. Our investment portfolios may or may not hold the securities mentioned. The reader should not assume that an investment in the securities identified was or will be profitable. For full performance information regarding Causeway’s strategies, please see www.causewaycap.com. For further information on the risks regarding investing in Causeway’s strategies, please go to https://www.causewaycap.com/wp-content/uploads/Risk-Disclosures.pdf.
The MSCI Emerging Markets Index is a free float-adjusted market capitalization index, designed to measure equity market performance of emerging markets, consisting of 24 emerging country indices.
The MSCI USA Index is designed to measure the performance of the large and mid cap segments of the US market. The index covers approximately 85% of the free float-adjusted market capitalization in the US.
The MSCI EAFE Index is an equity index which captures large and mid cap representation across Developed Markets countries around the world, excluding the US and Canada. The index covers approximately 85% of the free float-adjusted market capitalization in each country.
The S&P 500® is a gauge of large-cap US equities. The index includes 500 leading companies and covers approximately 80% of available market capitalization.
The MSCI Emerging Markets Information Technology Index and the MSCI USA Information Technology Index are designed to capture the large and mid-cap segments across 24 Emerging Markets (EM) countries and the US equity universe, respectively. All securities in the indexes are classified in the Information Technology sector according to the Global Industry Classification Standard (GICS®).
MSCI and S&P Global have not approved, reviewed, or produced this report, makes no express or implied warranties or representations and is not liable whatsoever for any data in the report. You may not redistribute the MSCI or S&P Global data or use it as a basis for other indices or investment products.