Contact Us
Subscribe to Causeway Insights, delivered to your inbox.
By Arjun Jayaraman
Head of Quantitative Research, Portfolio Manager
As we enter a new year, we believe it is time investors shed old notions of emerging markets equities. Emerging markets have advanced beyond singular thematic plays on commodities or China, for example. Instead, we believe they offer richly varied, multi-year growth drivers, from demographic shifts to burgeoning AI technologies. Their correlations with developed equity markets have been low and—for now—so are their valuations.
Here is why we believe an active emerging markets strategy deserves renewed attention in 2024:
1. Despite a surge in valuations in rapidly growing markets such as India and Taiwan, emerging markets small caps in general trade at discounts presently and many offer significant return potential.
2. Our emerging markets allocation model is becoming more positive on emerging markets versus global developed markets, due primarily to relative valuations. Future steepening of the yield curve may also favor the asset class, as it has historically.
3. Emerging markets equities as a group are becoming less economically cyclical, less commodity-linked, and less dependent on China.
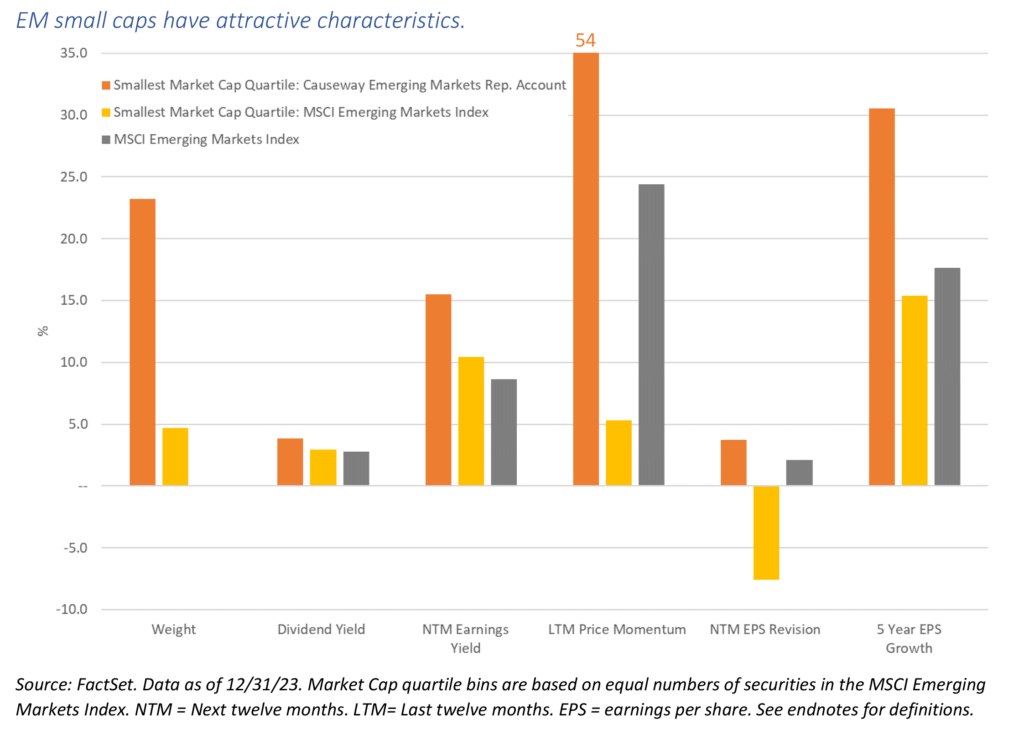
EM small caps offer value and earnings growth, together.
Emerging markets (“EM”) small caps presently are offering access to earnings growth at reasonable valuations. Small cap EM stocks offer a diverse investment opportunity set, with generally higher local country economic exposure (and lower US dollar revenue exposure) than their large cap peers. Their home-market focus means more idiosyncratic growth drivers relative to large firms. Like small caps generally, they tend to exhibit greater breadth and stock price inefficiencies than large caps, giving them, in our view, outsized alpha potential.
Small caps’ home-market focus means more idiosyncratic growth drivers relative to large firms.
Causeway’s Emerging Markets strategy currently is overweight small caps relative to the MSCI Emerging Markets Index (“MSCI EM Index”), an overweight position we have held for much of the strategy’s history, and most recently since the first quarter of 2021. Using our actively managed, multi-factor approach, the small cap holdings in the Causeway Emerging Markets strategy are currently exhibiting more attractive value, growth, and momentum characteristics than the small cap segment of the MSCI EM Index.
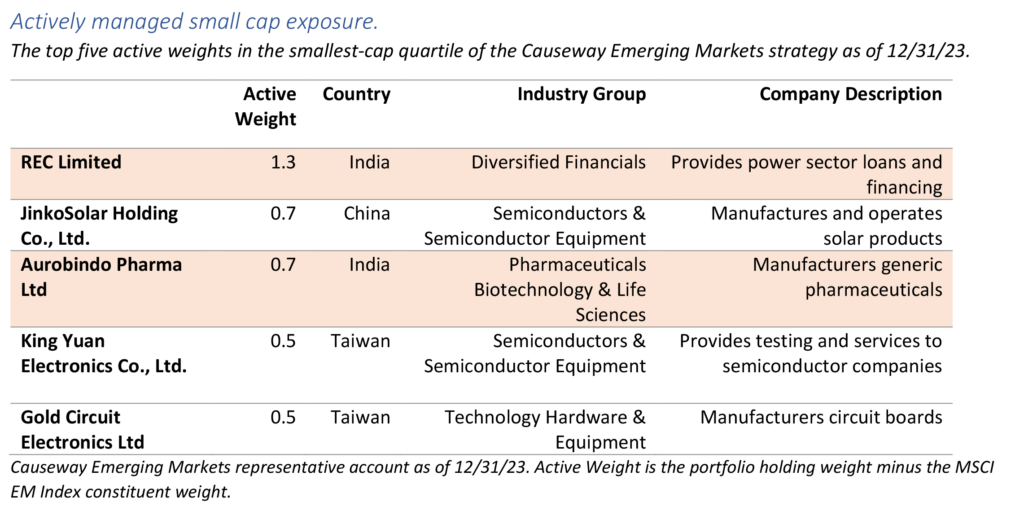
Within this small cap segment, the Causeway Emerging Market strategy is overweight India: within the smallest market cap quartile, the portfolio of a representative account has a 3.0% weight in India versus a 0.2% weight in the MSCI EM Index as of 12/31/23. India is the fastest-growing economy of the major emerging markets. Economists expect increased investment and consumption to drive India’s annual real gross domestic product growth of 6% for the remainder of this decade, an expansion rate well ahead of most large economies.
India is the fastest-growing economy of the major emerging markets.
Investors appear to have seized upon India’s attractive growth prospects, pricing the market as the most expensive in the MSCI EM Index on both a price-to-book value and price-to-earnings basis as of 12/31/23. But our process has identified small cap India-listed securities exhibiting, in our view, attractive combinations of value, growth, momentum, and competitive strength. Two of the largest active weights in the smallest cap quartile of the Causeway EM portfolio are Indian securities.
Relative valuations favor EM, with potential added boosts from yield curve normalization and central bank rate policies.
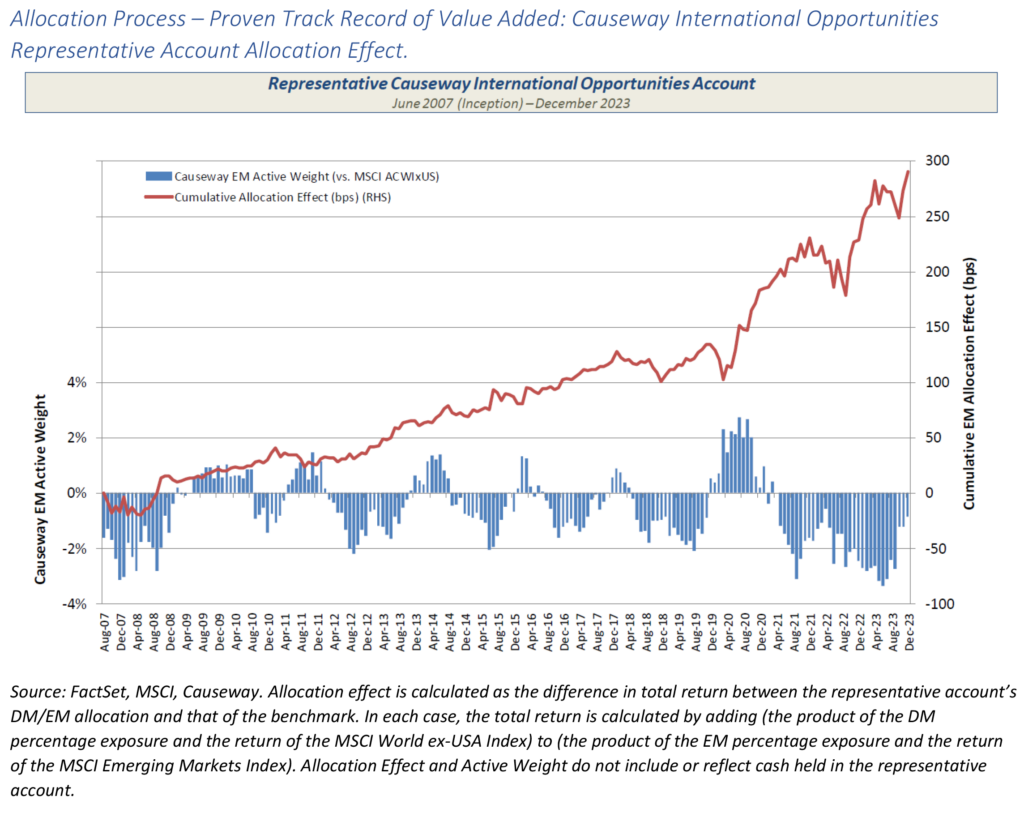
Causeway’s emerging markets equity allocation model has delivered alpha for the Causeway International Opportunities strategy (developed + emerging markets) since its inception over 16 years ago, indicating overweight or underweight emerging markets positions versus the weight of emerging markets in the MSCI ACWI ex US Index. The model assesses the relative attractiveness of emerging markets across five factor categories: valuation, quality, earnings growth, macroeconomic, and risk aversion. After more than two years of (beneficial) recommendations to underweight EM, our allocation model is becoming more positive on EM, primarily because of the considerably more attractive relative valuations of emerging markets.
The outlook for emerging markets equities could improve further if alleviating macroeconomic concerns prompt a normalization of the (currently inverted) yield curve. Historically, a steepening yield curve has been a positive signal for emerging markets’ equity performance.
Historically, a steepening yield curve has been a positive signal for emerging markets’ equity performance.
Due largely to inflation concerns, emerging market countries did not participate in the easy money era of low-to-negative short-term interest rates. We expect the central banks of larger emerging markets will remain monetarily prudent, continuing to eschew ultra-loose monetary policy. Developed market central banks, facing their own inflation challenges, should adhere to structurally higher interest rates going forward. This may put pressure on developed market equity valuation multiples. And interest payments on debt will comprise a greater share of country budgets, crowding out other types of spending. This relative interest rate dynamic may favor emerging market equities.
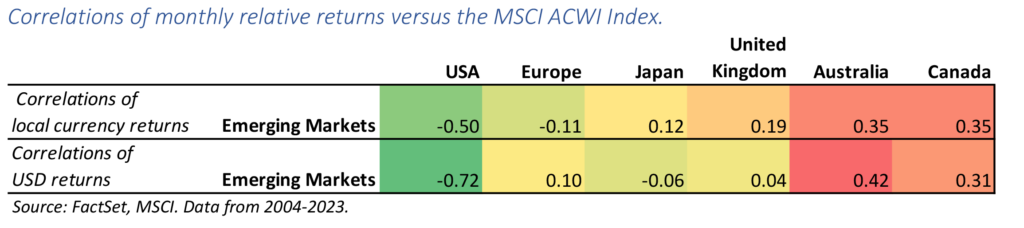
EM may become even more diversifying for equity portfolios.
Historically, emerging markets equities have been good diversifiers for US equities; less so for commodity-driven markets like Australia and Canada. But these commodity-driven correlations may decrease with changes to China’s role in emerging markets, as its maturing economy becomes a less voracious consumer of commodities and should its weight in the MSCI EM Index continue to diminish.
EM offers more than cyclicality.
EM has been associated with cyclicality, and indeed, some of the largest emerging markets, including South Korea and commodity producers Brazil and South Africa, exhibit high economic sensitivity. China is becoming less cyclical as it transitions from an investment-led, export-oriented economy into a consumer-led economy. Partially offsetting the cyclicality of these markets are long-term structural growth drivers from markets like India and Mexico, both of which may be beneficiaries of geopolitically motivated manufacturing shifts. Taiwan, with its leading precision manufacturing sector, should experience multi-decade growth from generative AI, barring adverse geopolitical developments. Further countering cyclicality are Taiwan’s generally attractive dividend payouts and relatively stable currency. No longer should emerging markets be thought of in purely cyclical terms.
Partially offsetting EM cyclicality are long-term structural growth drivers from markets like India, Mexico, and Taiwan.
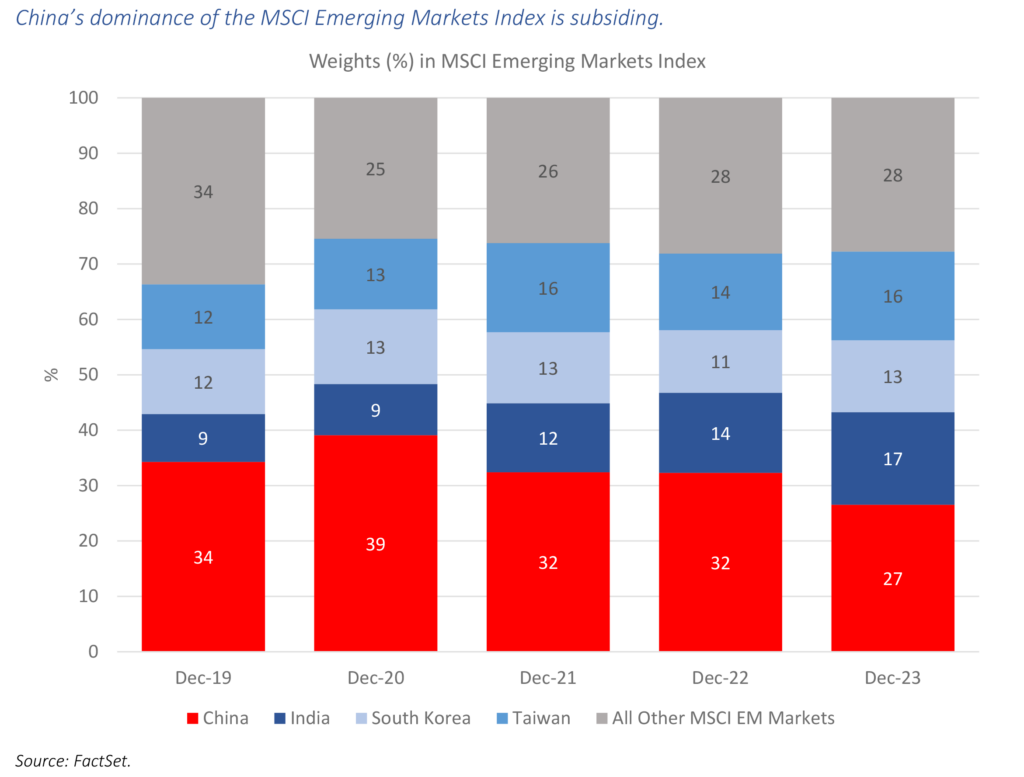
Nor are emerging markets simply a bet on China. With its initial resilience to Covid, China’s weight in the MSCI EM Index peaked during 2020, surpassing 40% in September of that year. Since then, it has diminished substantially, to 27% at year-end 2023.
Today’s emerging market equities, in all their breadth and complexity, are well suited for an actively managed strategy that seeks to capture the multiple alpha factors—and manage the multiple risks—of the asset class. We believe the differentiated drivers of return across emerging markets create attractive investment prospects for 2024 and beyond.
The Causeway Emerging Markets strategy uses quantitative factors that can be grouped into seven categories: valuation, growth, technical indicators, competitive strength, macroeconomic, country-sector aggregate, and currency. “Alpha” means performance exceeding the benchmark index.
This market commentary expresses Causeway’s views as of January 2024 and should not be relied on as research or investment advice regarding any stock. These views and any portfolio holdings and characteristics are subject to change. There is no guarantee that any forecasts made will come to pass. Forecasts are subject to numerous assumptions, risks, and uncertainties, which change over time, and Causeway undertakes no duty to update any such forecasts. Information and data presented has been developed internally and/or obtained from sources believed to be reliable; however, Causeway does not guarantee the accuracy, adequacy, or completeness of such information.
The views herein represent an assessment of companies at a specific time and are subject to change. There is no guarantee that any forecast made will come to pass. This information should not be relied on as investment advice and is not a recommendation to buy or sell any security. The securities identified and described do not represent all of the securities purchased, sold, or recommended for client accounts. Our investment portfolios may or may not hold the securities mentioned. The reader should not assume that an investment in the securities identified was or will be profitable. For full performance information regarding Causeway’s strategies, please see www.causewaycap.com.
Dividend yield is dividends paid divided by share price. NTM earnings yield is analysts’ estimated earnings per share for the next twelve months divided by the current market price per share. LTM price momentum is the portfolio-weighted average share price change over last twelve months. NTM EPS revisions is analysts’ estimated next twelve months earnings per share revisions. 5-year EPS growth is the slope of a linear regression using the last 5 years of reported EPS. Characteristics are weighted averages of companies in the EM representative account and indices.
The MSCI Emerging Markets Index is a free float-adjusted market capitalization index, designed to measure equity market performance of emerging markets, consisting of 24 emerging country indices. The MSCI ACWI Index is designed to represent performance of the full opportunity set of large- and mid-cap stocks across 23 developed and 24 emerging markets. The MSCI ACWI ex US Index is designed to represent performance of the full opportunity set of large- and mid-cap stocks across 22 developed and 24 emerging markets excluding the United States. The MSCI World ex US Index captures large and mid cap representation across 22 of 23 Developed Markets countries excluding the United States.
MSCI has not approved, reviewed, or produced this report, makes no express or implied warranties or representations and is not liable whatsoever for any data in the report. You may not redistribute the MSCI data or use it as a basis for other indices or investment products.