Contact Us
Subscribe to Causeway Insights, delivered to your inbox.
Cyclical and financial stocks (banks and insurance) have become irresistibly undervalued, especially relative to their defensive peers. From an overall global market view, value looks inexpensive relative to growth. We share some of the most compelling data points that support buying these neglected stocks.
2018 ended with investors shedding equities and portfolio risk. All markets have enjoyed the support of “cheap” money. By late 2018, global net asset purchases by central banks turned negative, led by the United States. For the first time since 2007, US cash yielded more than US stocks and the US yield curve continued to flatten. Other signs of investor nervousness included the widening of credit spreads and a significant increase in global stock markets volatility from prior years.
Risk aversion has become most acute in non-US developed markets. Stocks in industries such as utilities, real estate, food & staples retailing, household & personal products, telecommunications and pharmaceuticals typically outperformed overall markets in most regions in the fourth quarter of 2018. For Europe and the United Kingdom, in particular, the combination of tapering quantitative easing, concerns over a potential disorderly Brexit, Italian political risks, and European corporate earnings sensitivity to global trade likely unnerved investors. This may explain why European equities have “de-rated” back to five- year price-to-earnings (“P/E”) lows and dividend yields have risen nearly to Euro Crisis levels. UK stocks de-rated severely in 2018, and are currently trading at the cheapest levels in the past 25 years (except during the global financial crisis “GFC” in 2008-9) on a dividend yield basis. Measured by the earnings yield/bond yield premium, the UK stock market has only been cheaper twice in the past 100 years (during World War I and World War II)[1].
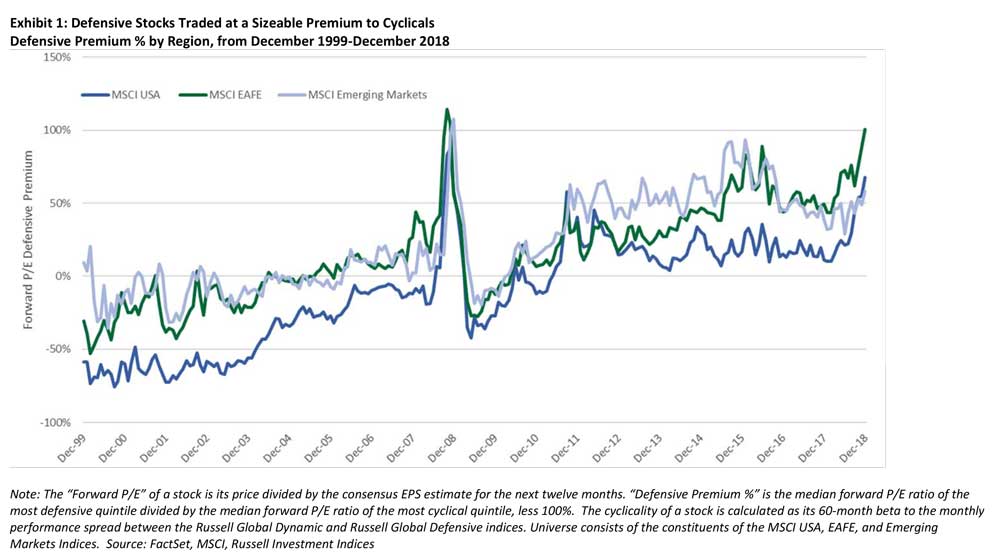
Exhibit 1 illustrates the defensive valuation premia across the major geographies at year-end 2018. EAFE markets contain the highest valuation gap between defensives/cyclicals, not only relative to the other geographies but even on a self-relative basis; the current defensive premium is nearly at the level that occurred during the height of the GFC. At year-end 2018, for example, UK beverages traded at all-time high valuations (typical P/E ratios of over 20x) while UK banks languished at discounts to book value and at single digit P/E multiples.
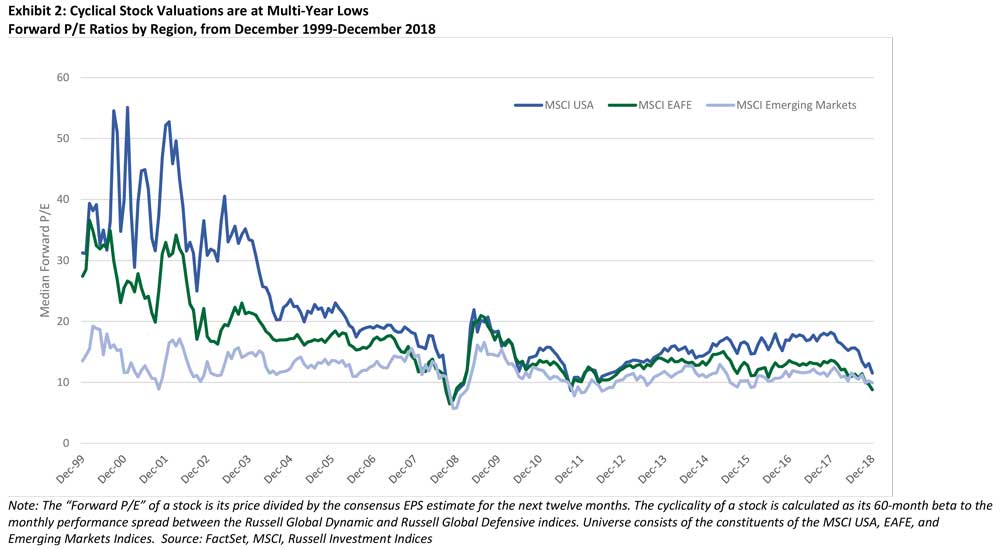
The P/E of EAFE cyclicals (Exhibit 2) is now cheaper than it was during the Euro Crisis in 2011 and approaching the GFC nadir. Cyclical and financial stocks (banks and insurance) have become irresistibly undervalued, especially relative to their defensive peers.
From an overall global market view, value looks inexpensive relative to growth – perhaps acutely inexpensive in the more worrisome regions of the developed world.
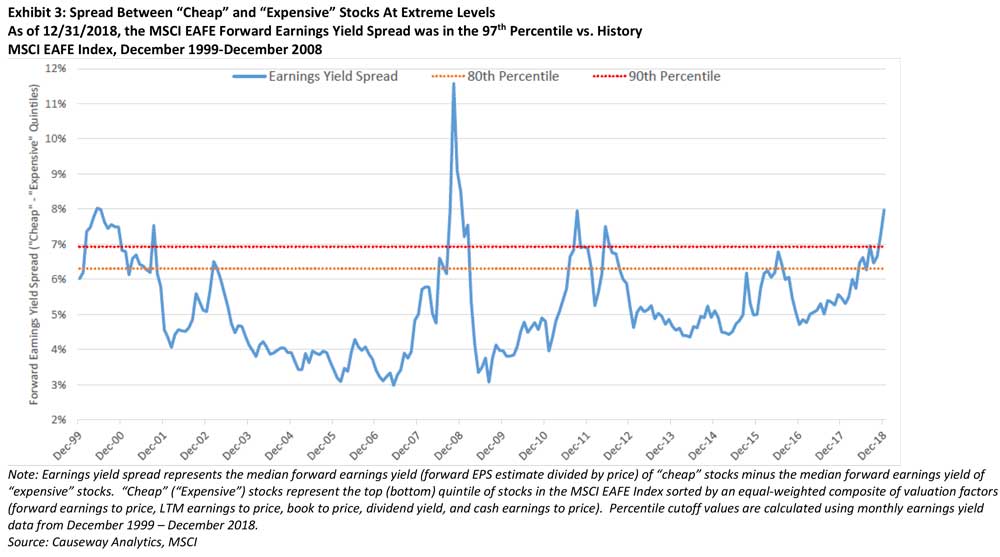
Exhibit 3 shows the earnings yield spread between the cheapest 20% of stocks (measured using a blend of valuation metrics) in the MSCI EAFE universe versus the most expensive 20%. As of 12/31/18, the 8% spread equates to the 97th percentile using data points starting in 1999.
How long will this underperformance of cheap stocks persist?
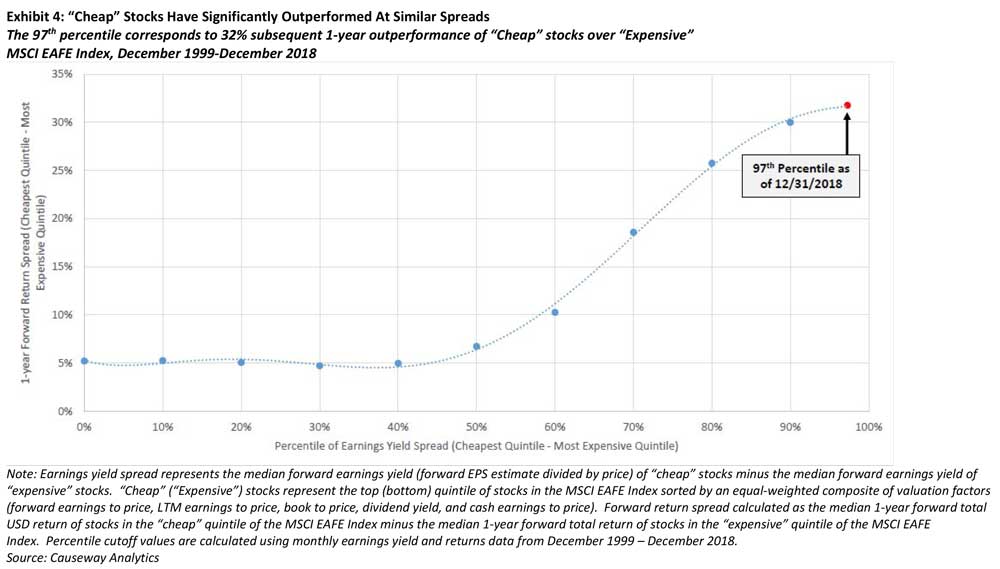
Exhibit 4 shows the relative return of the cheapest quintile versus the most expensive quintile over the following year. Using history since 1999 as a guide, at points in the past when this gap in earnings yield reached the 97th percentile, the cheap quintile outperformed the most expensive quintile by 32% over the next twelve months. Although timing cannot be predicted, we suspect that history will repeat itself, as it often does.
[1] Citi Research, January 3, 2019, “Global Equity Road Ahead”
This market commentary expresses Causeway’s views as of January 10, 2019 and should not be relied on as research or investment advice regarding any investment. These views and any portfolio holdings and characteristics are subject to change, and there is no guarantee that any forecasts made will come to pass. Any securities identified do not represent all of the securities purchased, sold or recommended by Causeway. The reader should not assume that an investment in any securities identified was or will be profitable. Forecasts are subject to numerous assumptions, risks and uncertainties, which change over time, and Causeway undertakes no duty to update any such forecasts. Information and data presented has been developed internally and/or obtained from sources believed to be reliable; however, Causeway does not guarantee the accuracy, adequacy or completeness of such information.
MSCI has not approved, reviewed or produced this report, makes no express or implied warranties or representations and is not liable whatsoever for any data in the report. You may not redistribute the MSCI data or use it as a basis for other indices or investment products.