Contact Us
Subscribe to Causeway Insights, delivered to your inbox.
The coronavirus selloff of 2020 has been particularly unforgiving for companies directly impacted by the virus and the coincident fall in consumer spending. Cyclical stocks have generally performed the worst during this year-to-date period. Judging by the recent performance of cyclical stocks, one could easily assume that the global economy will never fully recover. But as governments unleash unprecedented levels of monetary and fiscal stimulus, economies should benefit. Many of these economically sensitive companies should return to normal operations when COVID-19 no longer dominates the headlines.
Well before an economic recovery, equity markets will witness peak new coronavirus cases and we anticipate investors will want those stocks most ravaged by sellers, particularly those that have adeptly managed their businesses through this difficult period. In the meantime, Causeway has the rare opportunity—not seen since the Global Financial Crisis (GFC)—to buy shares in several “best-in-class” companies for our clients at sizable discounts to our estimates of fair value.
Key insights
- Market valuations of global cyclicals appear far too dire. Currently they imply that earnings will shrink by 4% annually—forever.
- We believe when the recovery inevitably comes, the market will be led by cyclicals, as it has following past drawdowns.
- In our view, a focus on quality is imperative, and we are using the environment to significantly upgrade our clients’ portfolios into shares of several "best-in-class" companies.
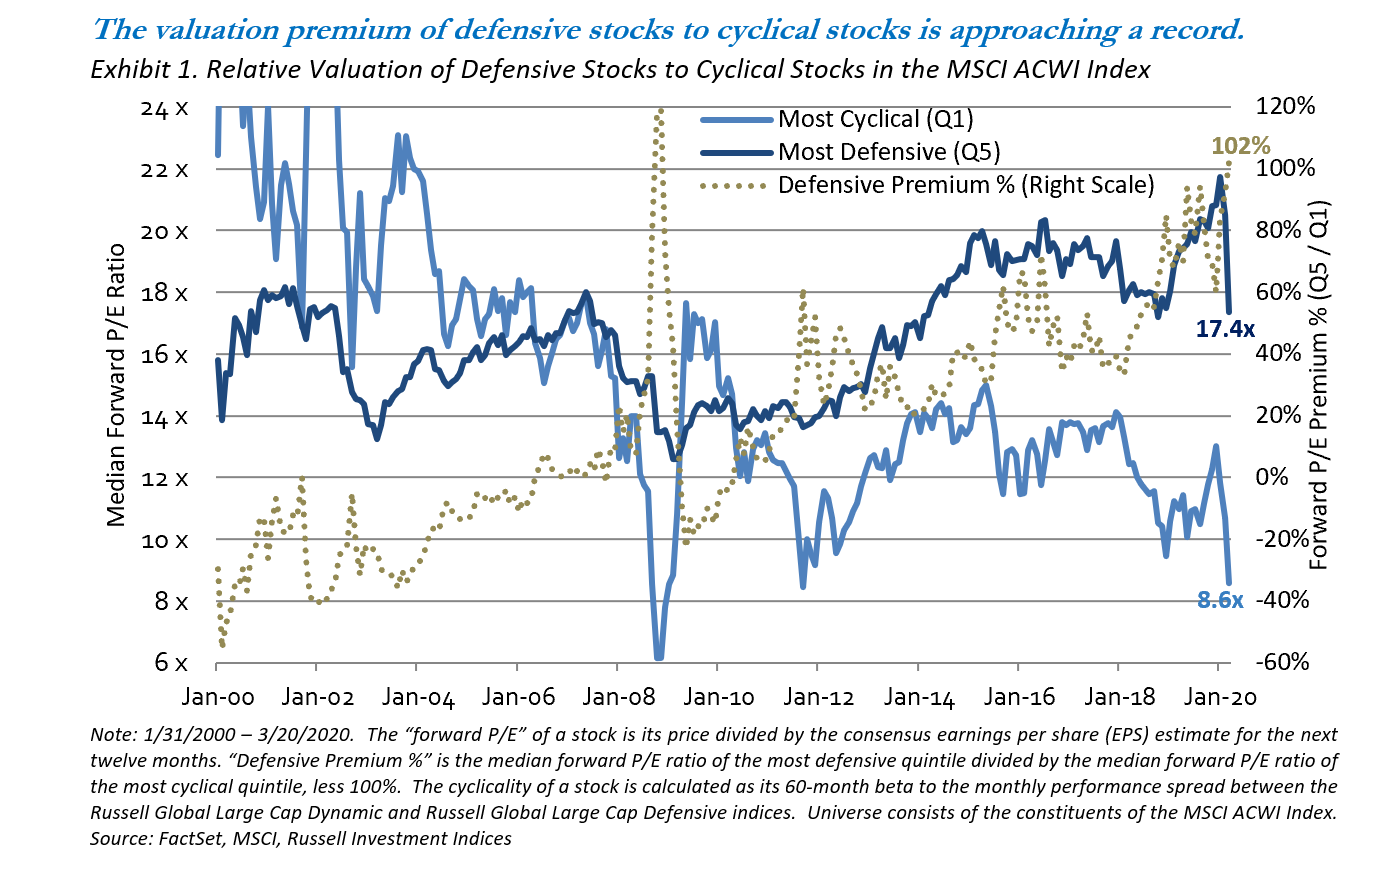
From a top-down valuation perspective, how extreme is the current buying opportunity? In Exhibit 1, we rank all stocks in the MSCI ACWI Index universe by their cyclicality, sort them into quintiles, and record the median forward price-to-earnings (P/E) multiple of the most extreme quintiles over time. The gold dotted line plots the significant valuation premium between the most defensive quintile (Q5) and the most cyclical quintile (Q1). As of March 20, 2020, defensive stocks traded at over twice the forward P/E multiple of cyclical stocks, and that premium is approaching the record peak from the GFC.
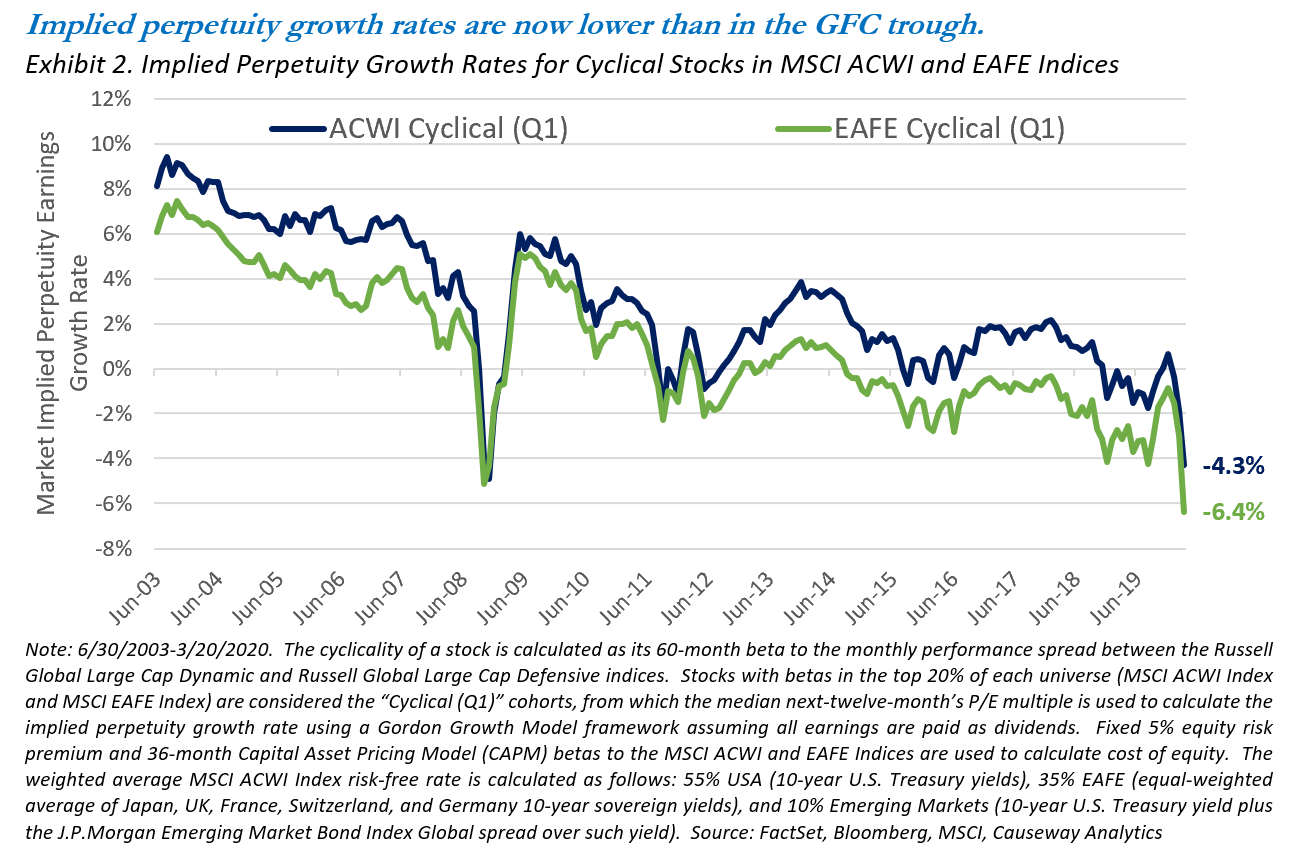
What is the market implying about future earnings for cyclical stocks? To answer this, the Gordon Growth model provides a useful framework, equating a stock’s price to the expected stream of future earnings per share (assuming all earnings are paid as dividends) discounted by its cost of equity. Rearranging variables, the market-implied perpetuity growth rate equals a stock’s cost of equity minus its forward earnings yield. Exhibit 2 plots this growth rate for the most cyclical quintile of the MSCI ACWI and MSCI EAFE Indices. Current multiples imply that earnings will perpetually shrink by 4% annually for cyclicals in the MSCI ACWI Index. Cyclicals in the MSCI EAFE Index reflect even greater pessimism and assume a 6% annual earnings decline – forever.
Fear, forced selling, and very short investment horizons may explain this temporary disconnect between these well-run cyclical companies and their current, extremely low equity valuations.
At the stock level, we believe the most compelling opportunities for our clients are at the epicenter of the economic pain from coronavirus lockdowns. These include industrials (transportation, capital goods, and especially aerospace), consumer discretionary (travel & tourism, automotive, and retail), financials (banks and insurance), and other travel-related businesses such as global distribution system software. Will aircraft continue to need maintenance? Will aerospace companies still need engine technology and materials? Will travelers no longer buy meals and sundries in airports and train stations? Will consumers not need catering at places of employment, hospitals, schools, and sporting events? Will travel agents stop using software to book flights and hotels? We are finding high-quality cyclical companies, often operating with few competitors in oligopolies, offering strong balance sheets and talented, proven management teams. Unlike the GFC, banks are not the problem this time. The world’s best banking institutions, in our view, have at least double the level of capital they had in 2008, yet some trade at lower valuations than in the GFC. Fear, forced selling, and very short investment horizons may explain this temporary disconnect between these well-run cyclical companies and their current, extremely low equity valuations.
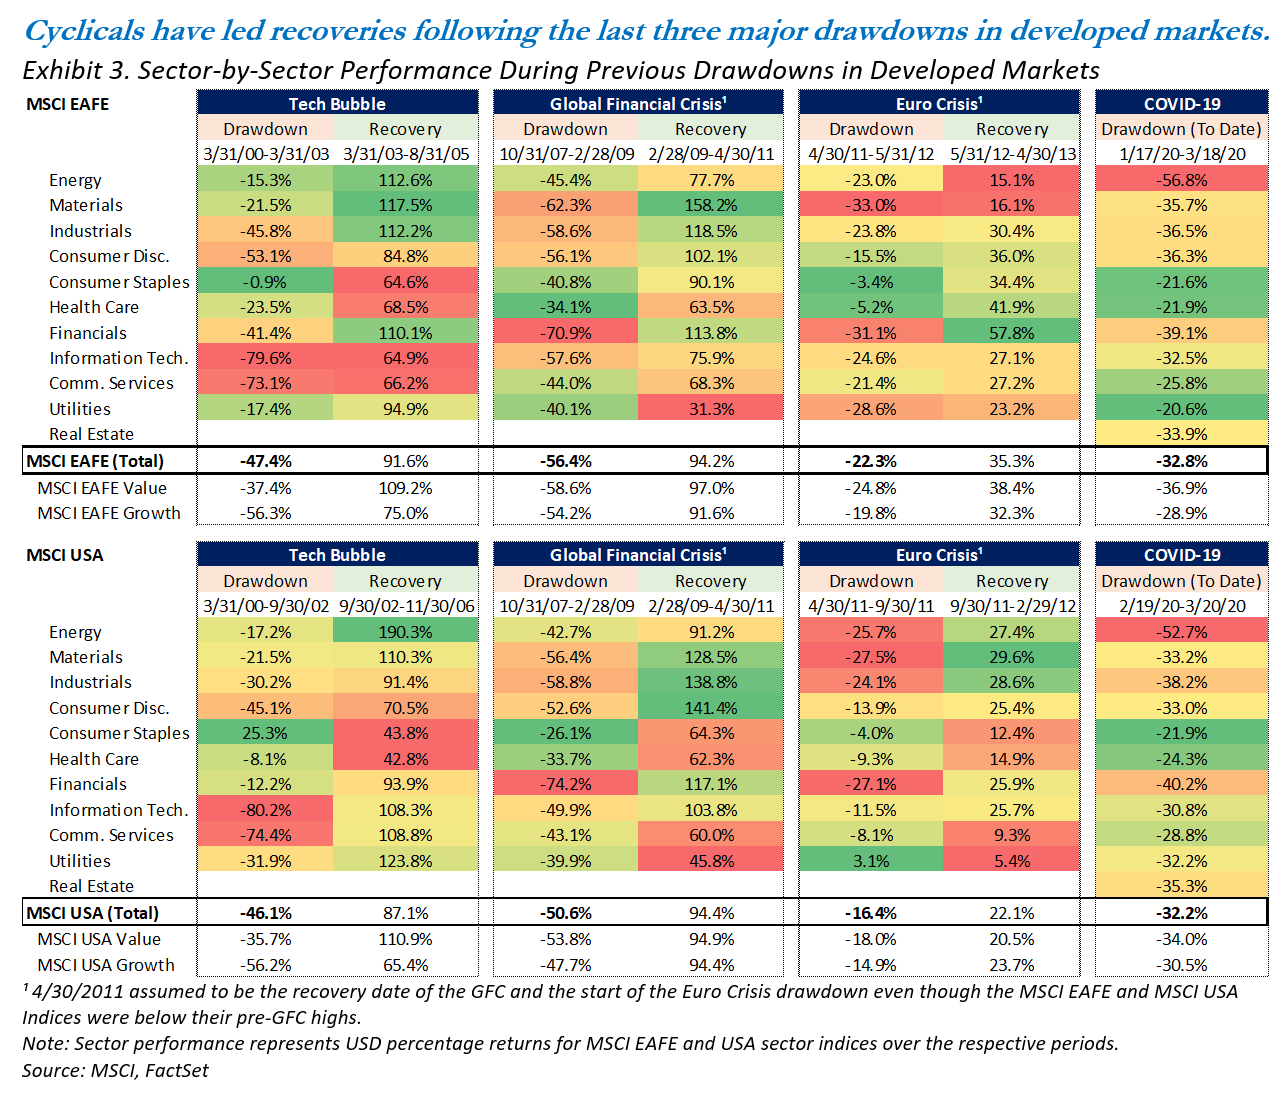
Why buy these cyclical stocks now, rather than wait for better economic news? Exhibit 2 implies a level of pessimism currently even more negative than during the GFC and simply irreconcilable with nearly any historical period. And when the recovery inevitably comes, which we believe will happen, the market should be led by cyclicals, at least if past drawdowns are any indication. In Exhibit 3, we examined sector behavior during the largest three previous drawdowns and recoveries over the past 25 years in developed markets (MSCI EAFE Index countries and the US): The Tech Bubble, the Global Financial Crisis, and the Euro Crisis. One consistent trend is that the more cyclical sectors (industrials, consumer discretionary, financials) tended to outperform more defensive sectors (consumer staples, health care, utilities) during recoveries.
Value stocks have consistently outperformed growth stocks in past drawdown recoveries.
The energy and materials sectors also tended to perform well in recoveries, but they are equally dependent on commodity price cycles. And in the current drawdown, the energy sector has been a hostage of the Saudi/Russia oil price war. It is important to note that the performance of the communications services sector may differ this time around with the inclusion of internet stocks. The sector underperformed in previous recoveries when it was exclusively telecommunications services, a more defensive industry group. Finally, we also note that value stocks have consistently outperformed growth stocks in past drawdown recoveries.
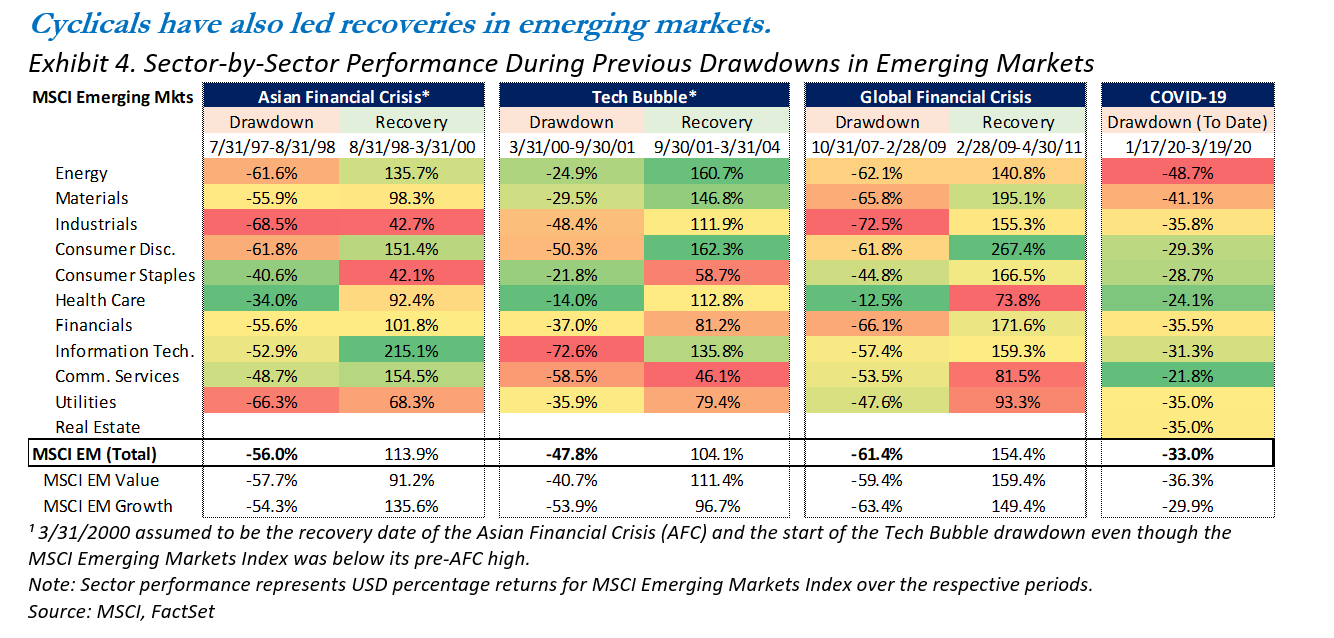
If we conduct the same sector-by-sector analysis on drawdowns in emerging markets (see Exhibit 4), the experience has been similar, except that the Euro Crisis was eclipsed in magnitude by the Asian Financial Crisis of the late 1990s. Once again, cyclical sectors (such as consumer discretionary, energy, and materials) tended to outperform defensive sectors (such as health care, utilities, and consumer staples) during recoveries. Information technology (IT), currently the largest sector overweight in Causeway’s Emerging Markets equity strategy, also tended to participate well in rebounds. The energy and materials sectors benefited from the commodities super-cycle coming out of the Tech Bubble drawdown, and their experience this time will be heavily influenced by the Russia/Saudi dynamic previously mentioned. Value also outperformed growth during past recoveries in emerging markets, and this time around, we believe value should bounce back given that it had such poor performance going into this sell-off.
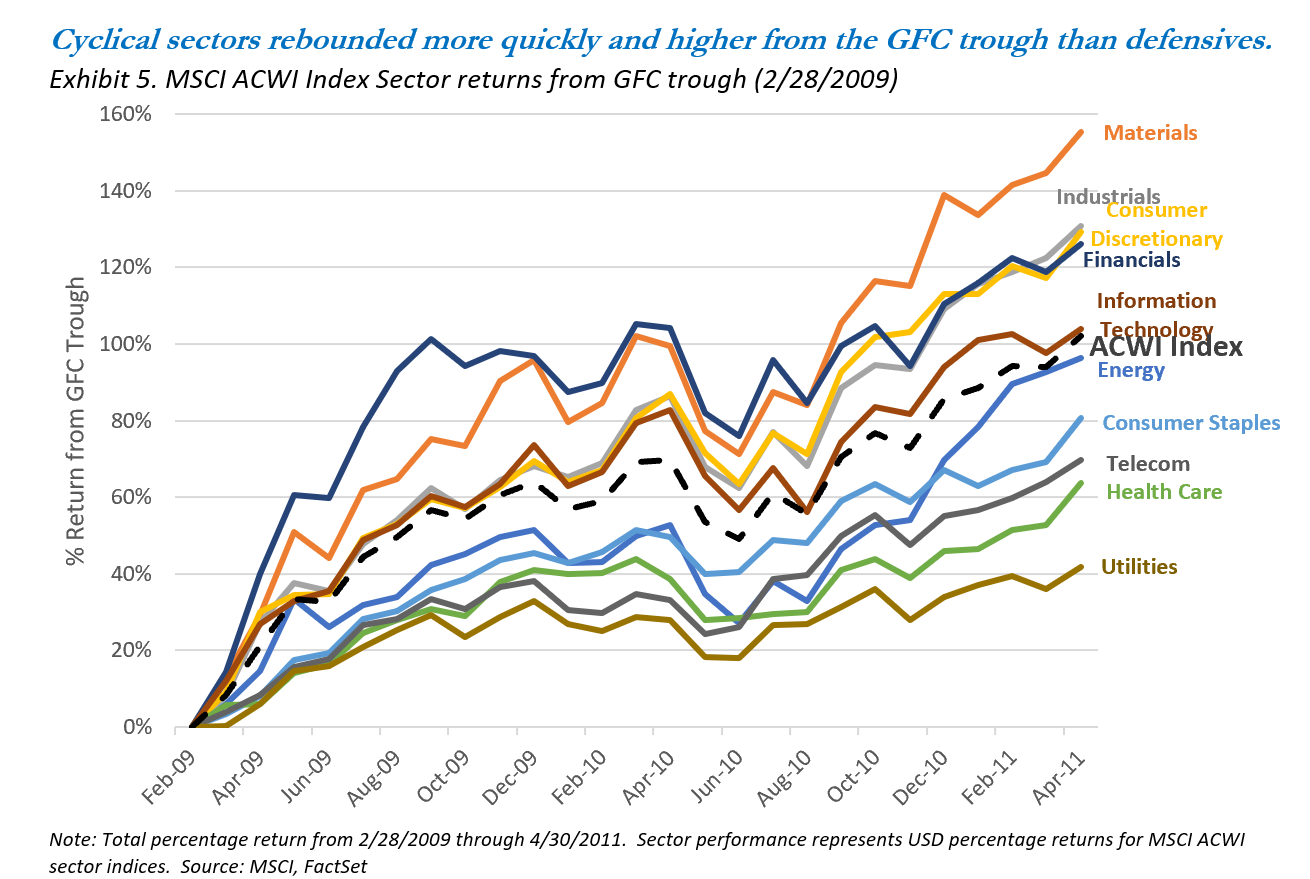
Finally, blending together developed and emerging markets into an MSCI ACWI Index context, we track sector performance in the 26 months following the GFC trough (at which point the MSCI ACWI Index had recaptured its pre-GFC highs). Exhibit 5 illustrates the pace and magnitude of the recoveries for each sector. Once again, all of the sectors leading the recovery were cyclicals while the laggards were defensives. It is also worth noting that this result largely holds true if we use the valuation/multiples trough date (10/31/2008) instead of the price trough date (2/28/2009), with the one exception being financials.
Cheap stocks today will get far cheaper if they cannot manage through liquidity and funding challenges presented over the coming weeks and months.
If cyclicals lead the eventual recovery, and the entire group is trading cheaper than ever, which cyclicals are the best buys? We believe a focus on quality is imperative. Cheap stocks today will get far cheaper if they cannot manage through liquidity and funding challenges presented over the coming weeks and months. And some may manage through only by diluting equity holders through capital raises. But with all cyclicals on sale at clearance prices, we can be very selective. We are focusing on companies that we believe have excellent management teams, defensible franchises, and the resources to weather the current storm. Though we believe most energy companies currently fail to meet our threshold, we have found plenty of bargains in “best-in-class” transportation, tourism/hospitality, financials, industrials, materials, and consumer discretionary stocks. We have more buying opportunities than capital to invest, so we are using the environment to significantly upgrade our clients’ portfolios.
We believe markets will begin to price in an economic recovery well before the world is clear of coronavirus.
Indiscriminate selling this year has shrunk stock markets to levels that we believe offer some of the greatest upside potential since the GFC. We believe markets will begin to price in an economic recovery well before the world is clear of coronavirus, but cyclicals are now trading at valuations that suggest significant and permanent earnings impairment. Many companies will undoubtedly face credit and liquidity hurdles, but we believe the high-quality cyclicals will lead the market recovery as they have in the past. And, in the meantime, we have been given a once-in-a-decade opportunity to buy these stocks at, in our view, enormous discounts to fair value.
This market commentary expresses Causeway’s views as of March 24, 2020 and should not be relied on as research or investment advice regarding any stock. These views and any portfolio holdings and characteristics are subject to change. There is no guarantee that any forecasts made will come to pass. Forecasts are subject to numerous assumptions, risks, and uncertainties, which change over time, and Causeway undertakes no duty to update any such forecasts. Information and data presented have been developed internally and/or obtained from sources believed to be reliable; however, Causeway does not guarantee the accuracy, adequacy, or completeness of such information.
International investing may involve risk of capital loss from unfavorable fluctuations in currency values, from differences in generally accepted accounting principles, or from economic or political instability in other nations.
The MSCI ACWI Index is a market capitalization weighted index designed to provide a broad measure of equity-market performance throughout the world and is comprised of stocks from 23 developed countries and 24 emerging markets.
The MSCI EAFE Index is an equity index which captures large and mid-cap representation across 21 Developed Markets countries around the world, excluding the US and Canada. The MSCI EAFE Value Index is a subset of the MSCI EAFE Index, and targets 50% coverage of the MSCI EAFE Index, with value investment style characteristics for index construction using three variables: book value to price, 12-month forward earnings to price, and dividend yield. The MSCI EAFE Growth Index is a subset of the MSCI EAFE Index and targets the remaining 50% coverage.
The MSCI USA Index is a free float-adjusted market capitalization index, designed to measure the performance of the large and mid-cap segments of the US market. The MSCI USA Value Index is a subset of the MSCI USA Index, and targets 50% coverage of the MSCI USA Index, with value investment style characteristics for index construction using three variables: book value to price, 12-month forward earnings to price, and dividend yield. The MSCI USA Growth Index is a subset of the MSCI USA Index and targets the remaining 50% coverage.
The MSCI Emerging Markets Index is a free float-adjusted market capitalization index, designed to measure the performance of the large and mid-cap segments of 26 emerging markets countries. The MSCI Emerging Markets Value Index is a subset of the MSCI Emerging Markets Index, and targets 50% coverage of the MSCI Emerging Markets Index, with value investment style characteristics for index construction using three variables: book value to price, 12-month forward earnings to price, and dividend yield. The MSCI Emerging Markets Growth Index is a subset of the MSCI Emerging Markets Index and targets the remaining 50% coverage.
The Russell Global Large Cap Stability Indexes measure a portion of the market based on the sensitivity to economic cycles, credit cycles, and market volatility, referred to as stability. Stability is measured at the company level in terms of volatility (price and earnings), leverage, and return on assets. The more stable half of the index is called the Russell Global Large Cap Defensive Index and the less stable half is called the Russell Global Large Cap Dynamic Index.
The J.P.Morgan Emerging Markets Bond Index Global tracks total returns for traded external debt instruments in the emerging markets.
These indices are gross of withholding taxes, assume reinvestment of dividends and capital gains, and assume no management, custody, transaction, or other expenses.
MSCI has not approved, reviewed, or produced this report, makes no express or implied warranties or representations, and is not liable whatsoever for any data in the report. You may not redistribute the MSCI data or use it as a basis for other indices or investment products.
“Gordon Growth Model” is used to determine the intrinsic value of a stock based on a future series of earnings (or dividends) that grow at a constant rate. Given an earnings per share (or dividend per share) that is payable in one year, and the assumption the earnings (or dividends) grow at a constant rate in perpetuity, the model seeks to solve for the present value of the infinite series of future earnings (or dividends).
Beta is a measurement of sensitivity to the benchmark index. A beta of 1 indicates that a portfolio’s value will move in line with the index. A beta of less than 1 means that the portfolio will be less volatile than the index; a beta of greater than 1 indicates that the security’s price will be more volatile than the index.