Contact Us
Subscribe to Causeway Insights, delivered to your inbox.
Outside of expensive renewables pure plays, how can investors participate in the energy transition?
Causeway portfolio manager Steve Nguyen and our renewables analysts share their insights.
In the shallow waters of the North and Baltic Seas, over 5,000 wind turbines churn, collectively supplying 25 gigawatts, or 3%, of Europe’s annual electricity demand. This renewable energy source is set to markedly increase; this year, by our tally, governments globally plan to auction nearly as much offshore wind power capacity as has been built cumulatively to date. This rapid growth reflects the quickening pace of the energy transition. The United Nations adopted the first global climate treaty nearly a quarter century ago, but it is only in the last few years that a growing chorus of countries, policymakers, and corporations have pledged substantial carbon emission reductions. According to the United Nations, over 110 countries, including the United States, have committed to carbon neutrality by 2050, and China, currently responsible for over one quarter of global emissions, is targeting neutrality by 2060. This convergence of action from public and private sectors is not only at the urging of scientists, but also is propelled by step-changes in technology that enable renewable energy investments to contribute to economic growth. The global energy transition may benefit companies the market is overlooking.
Key insights
- Investors are concerned that the entry of integrated oil companies into renewables development will drive down returns for all energy transition participants.
- In our view, spending constraints coupled with ample growth potential for all renewables developers should allow both the current market leaders (utilities) and new entrants (IOCs) to profitably accelerate renewables investment.
- Pure play renewables companies may occupy the energy transition limelight, but we see more valuation upside in renewables-focused utilities and integrated oil companies.
Burning fossil fuels for electricity accounts for most of the world’s carbon dioxide gas emissions, centering global decarbonization efforts around the power sector. Many utilities companies are leading the construction of clean power infrastructure and many oil & gas companies are endeavoring to diversify their energy portfolios. But the specter of disruption weighs on their share prices. We believe the market is underestimating the ability of these companies to earn competitive returns on their energy transition investments, creating opportunities for valuation-focused investors with multi-year investment time horizons.
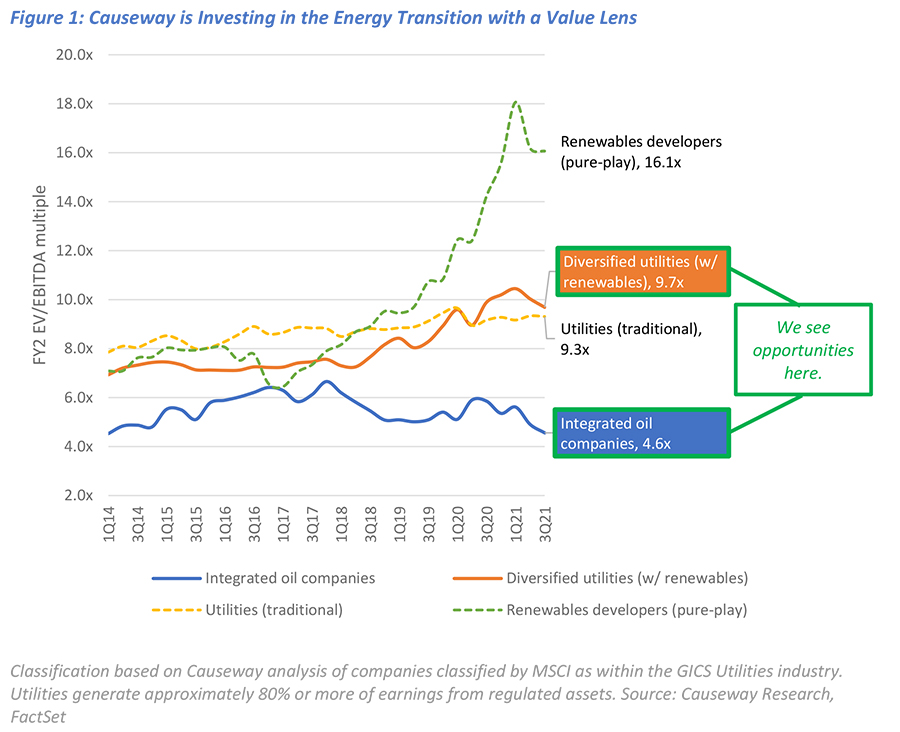
Diversified utilities with renewables exposure trade at a 40% discount to utilities focused exclusively on renewables development (“pure play” firms), and integrated oil companies (“IOCs”) trade at a discount of over 70%, using two-year forward earnings multiples. The market may be undervaluing their renewables businesses. The utilities sector offers direct exposure to the buildout of renewable energy sources and their related transmission and distribution infrastructure. We believe Causeway global and international value client portfolios hold utilities that can concurrently deliver defensive characteristics such as generous and well-covered dividend payouts, and accelerate growth through renewables development and grid modernization. We are most interested in those companies executing a transparent strategy to de-carbonize their asset portfolios. We expect the greatest upside potential in utilities that are in the first few years of their renewables’ transitions. Their current asset bases of undesirable coal or nuclear plants are garnering overly punitive market discounts or investment mandate exemptions. In the energy sector, we prefer European IOCs that are re-shaping their business models to address peak oil demand risks, while maintaining balance sheet strength and returning cash to shareholders. In our view, these large IOCs have the financial capability, the expertise, and the motivation to navigate this transition.
In our view, these large IOCs have the financial capability, the expertise, and the motivation to navigate this transition.
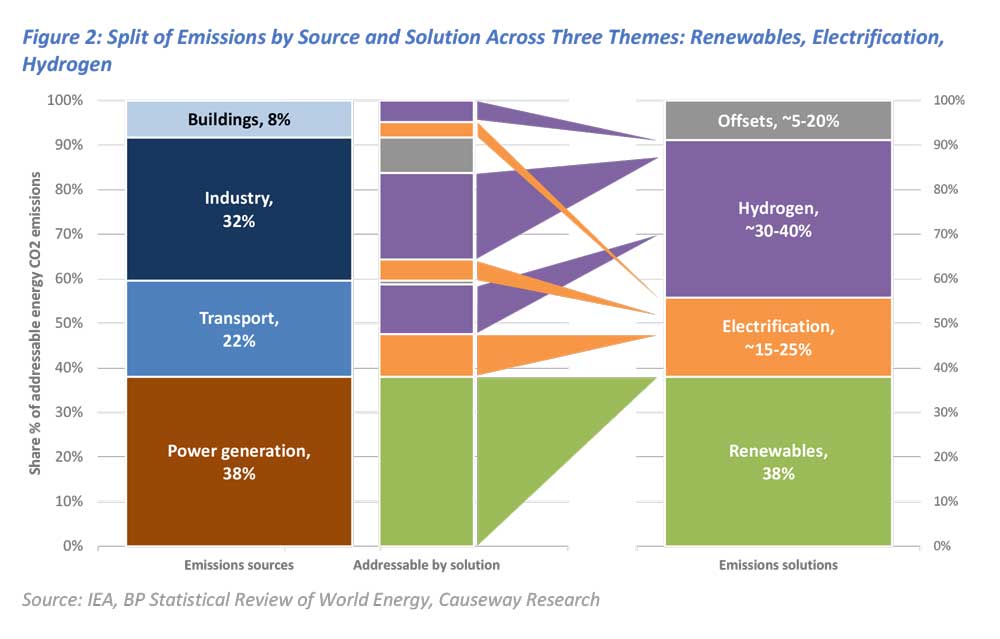 Two categories of change—using electricity over other energy types, called “electrification,” and producing electricity from renewable sources—can reduce, in our estimation, about 50%-60% of the world’s carbon emissions, with offsets and “clean fuel” hydrogen able to remove the remainder by 2060-2070.
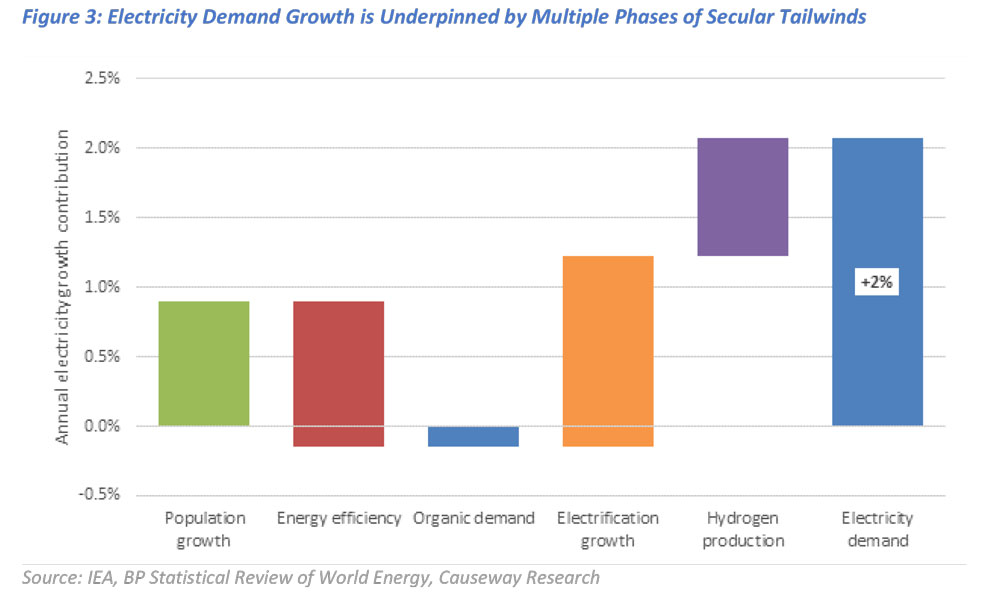
As we outlined in our energy transition webinar, we believe cost competitiveness should drive both changes. Technological developments have lowered the costs of most renewable energy sources to or below parity with costs of conventional power. No longer reliant on government subsidies, renewables technology is reaching its steepest rate of adoption. Lower cost, clean-powered lithium-ion batteries should support mass adoption of electric passenger vehicles. We estimate that electrification trends will more than offset ongoing energy efficiency improvements, creating net electricity demand growth of 2% annually, on average, through 2040. The need to replace retiring power plants (primarily coal) should boost supply growth. We expect renewables supply to expand an average of 12% annually, within which offshore wind will grow the fastest at an average annual rate above 20%.
No longer reliant on government subsidies, renewables technology is reaching its steepest rate of adoption.
Investors are concerned that the entry of IOCs will drive down returns for all energy transition participants, creating a headwind for renewables valuations. We can analyze the competitive dynamics between utilities and IOCs through the microcosm of offshore wind power generation. Utilities generally have the longest history in offshore wind, with multi-decade development track records and established pipelines for future projects. Many IOCs are skilled managers of large and complex energy projects, and their deep-water expertise should benefit them as wind power developments move further offshore. We believe the competitive threat from IOCs is overstated. In our view, their spending constraints coupled with ample growth potential for all renewables developers should allow both the current market leaders (utilities) and new entrants (IOCs) to profitably accelerate renewables investment.
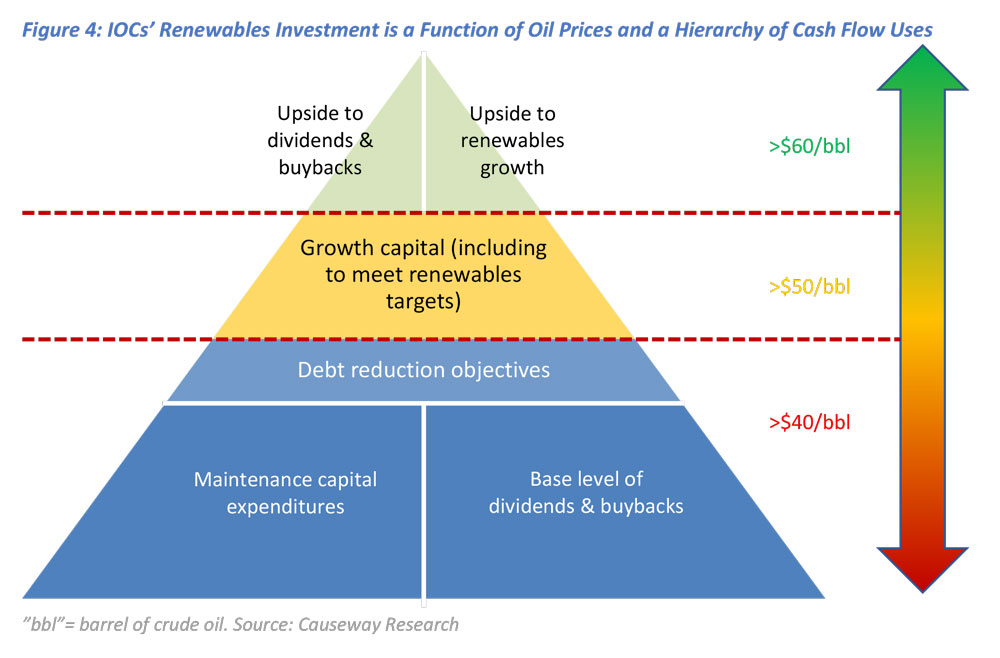
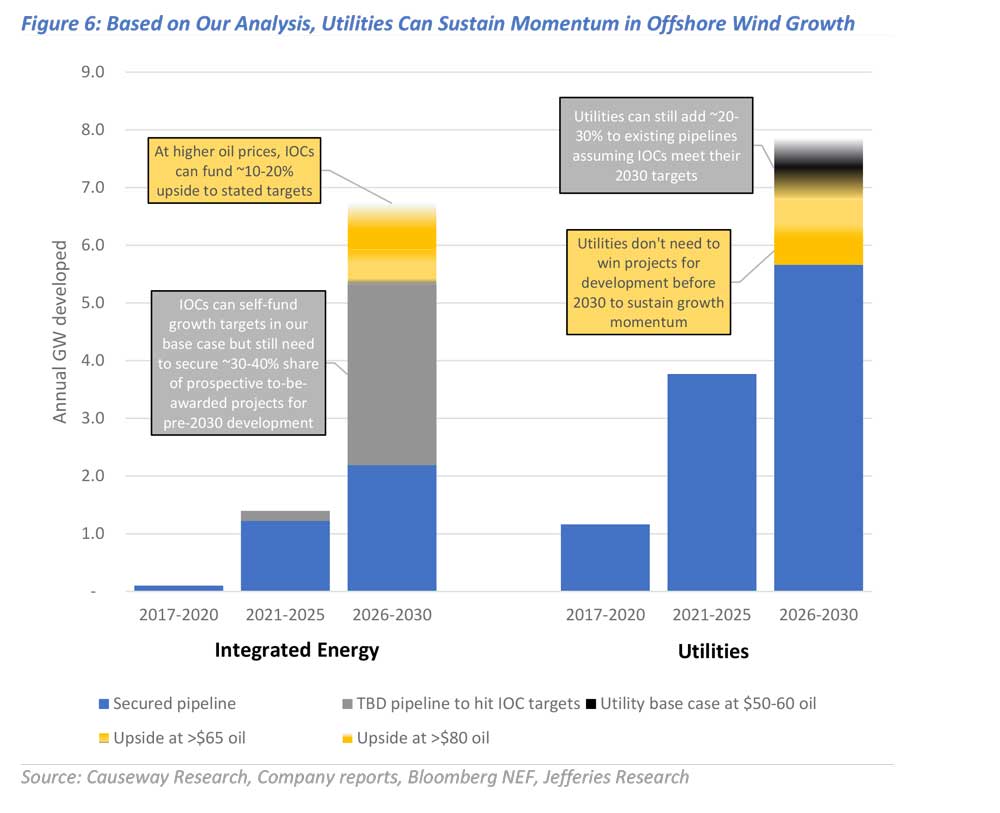
The free cash flow available for IOC renewables investments is a function of the crude oil price and a hierarchy of cash flow uses. We developed a framework to analyze the extent to which IOCs can internally fund renewables development for given oil price ranges. To meet their self-set renewables development targets by 2025 and 2030, we estimate European IOCs will need to increase capital investment in renewables by about 20% over the next few years, and then by 65% over the next five-year period. By our calculations, a sustained oil price of $50-$55 per barrel should allow these companies to maintain their base level of shareholder payouts, meet their debt reduction targets, and sufficiently scale their renewables businesses to diversify their earnings mix and manage longer-term stranded asset risk. Oil prices above this range tend to generate even more free cash flow, but additional renewables investments compete for capital with other growth investments and incremental capital return to shareholders. To us, current valuations of certain IOCs underappreciate their ability to increase shareholder distributions while executing renewable growth strategies.
By our calculations, a sustained oil price of $50-$55 per barrel should allow these companies to maintain their base level of shareholder payouts, meet their debt reduction targets, and sufficiently scale their renewables businesses.
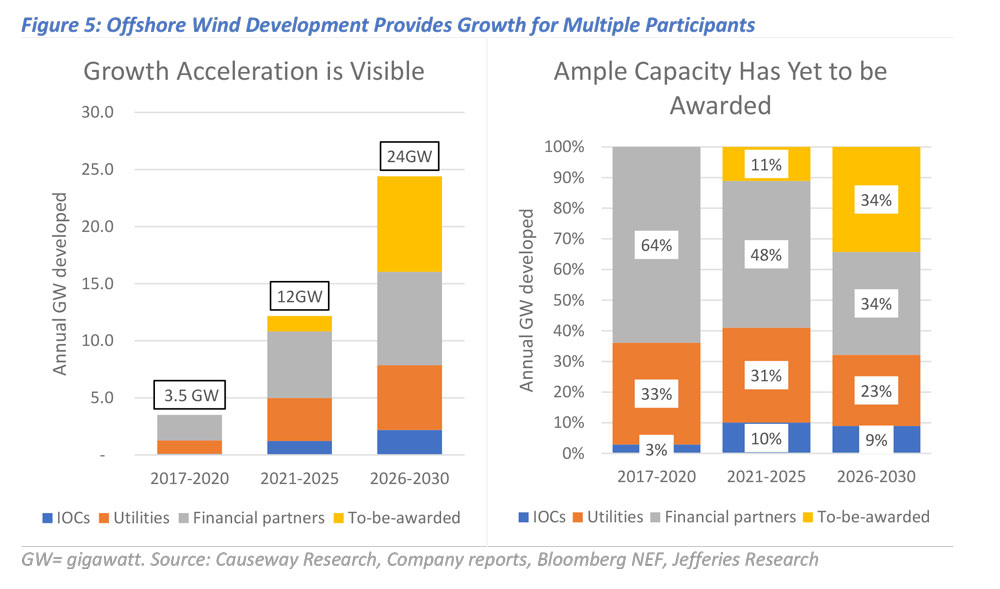
Even in an upside oil price scenario, we believe that increased renewables investment from IOCs should not crowd out utilities and drive down their returns. If, for example, oil prices stay above $65 per barrel, we estimate IOCs could increase their pace of offshore wind additions by 10-20%, allowing utilities to retain 30-40% of new capacity. Using our top-down offshore wind growth forecasts (Figure 5), which are anchored by long-term government targets, even this reduced share for utilities beyond 2025 is more than three times the pace of current offshore wind development. Put another way, we estimate utilities need only win a quarter of “to-be-awarded” offshore leases to maintain above 30% market share. In our view, the market is expanding enough for utilities to be selective in future project bidding for attractive returns.
For both utilities and IOCs, we believe the returns on renewables projects are further supported by low-cost funding. Capital markets participants’ growing appetites for clean energy are reducing project-level costs of capital by offering low interest rate debt, including low-coupon green and sustainability-linked bonds. And, after construction, utilities and IOCs can sell stakes in wind and other green assets to institutional funds and other infrastructure buyers.
Pure play renewables companies may occupy the energy transition limelight, but we see more valuation upside in renewables-focused utilities and IOCs. We believe diversified utilities can re-rate upward as their renewables progress proves sustainable alongside competitors. We expect investors will increasingly appreciate the credibility of the IOCs’ ambitious plans to become material renewables players, which should, over time, offset longer-term concerns about the future of oil & gas.
This market commentary expresses Causeway’s views as of July 2021 and should not be relied on as research or investment advice regarding any stock. These views and any portfolio holdings and characteristics are subject to change. There is no guarantee that any forecasts made will come to pass. Forecasts are subject to numerous assumptions, risks, and uncertainties, which change over time, and Causeway undertakes no duty to update any such forecasts. Information and data presented has been developed internally and/or obtained from sources believed to be reliable; however, Causeway does not guarantee the accuracy, adequacy, or completeness of such information.
International investing may involve risk of capital loss from unfavorable fluctuations in currency values, from differences in generally accepted accounting principles, or from economic or political instability in other nations.
MSCI has not approved, reviewed, or produced this report, makes no express or implied warranties or representations and is not liable whatsoever for any data in the report. You may not redistribute the MSCI data or use it as a basis for other indices or investment products.