Contact Us
Subscribe to Causeway Insights, delivered to your inbox.
Causeway portfolio manager Ryan Myers shares how small caps are cheap by historical standards, and why we believe this valuation discount will not last long.
If you have a longer-term investment horizon, the valuation of small caps relative to larger peers is becoming difficult to ignore.
Smaller cap stocks typically trade at a premium to larger companies, given their higher earnings growth potential. But investors also expect them to be more vulnerable to an economic slowdown.
Recently, against a persistent recession drumbeat, small cap valuation multiples have declined rapidly versus larger cap companies. The mega-cap rally in the US has further widened the valuation gap.
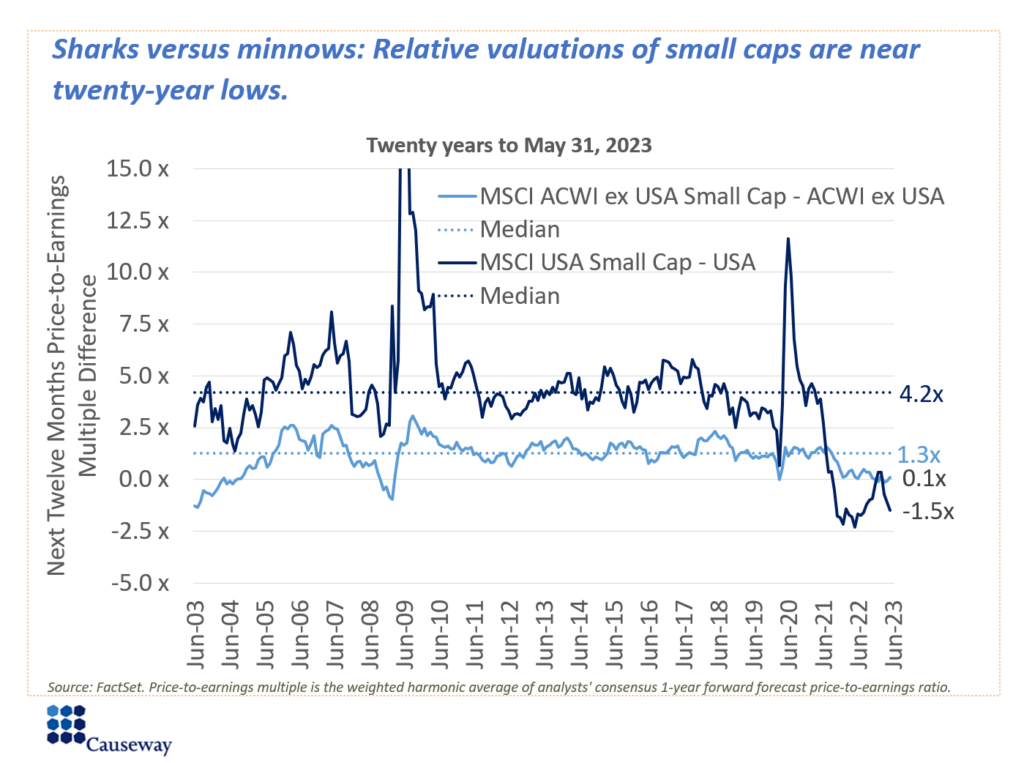
- The international small cap premium has shrunk to only 0.1x versus a long-term median of 1.3x
- In the US, this valuation anomaly is even more pronounced. US small caps are trading at a 1.5x discount to larger peers, versus a long-term median premium of 4.2x.
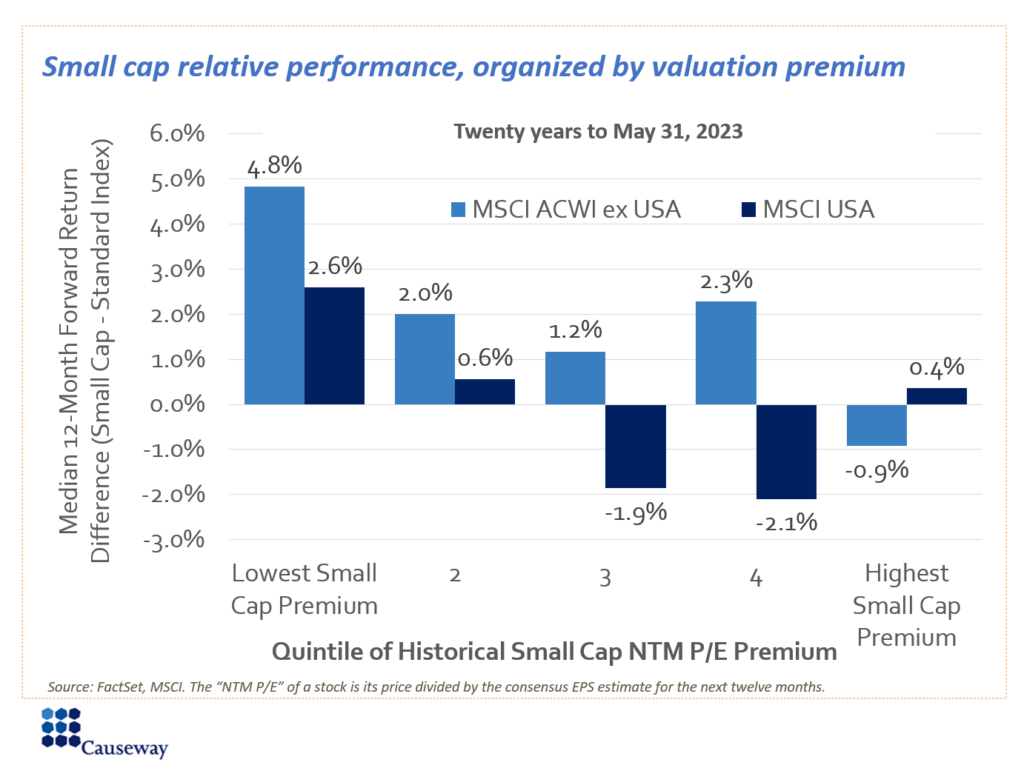
Let’s examine subsequent returns during historical periods when the small cap premium has shrunk to similar levels as we are currently observing.
In the chart below, we break up the last 20 years of valuation data into quintiles based on the magnitude of the small cap valuation premium (i.e., MSCI USA Small Cap NTM P/E – MSCI USA NTM P/E), then measure the difference between small cap performance and standard index (mid/large cap) performance over the following 12 months. So the left-most quintile represents periods in the past when the small cap valuation premium was lowest (or even negative), and the chart shows that this quintile has produced the largest relative return for small caps over the subsequent 12 months. Based on the 5/31/2023 data points, the MSCI ACWI ex USA small cap premium is in the 13th percentile and the MSCI USA small cap premium is in the 4th percentile. Both points put us firmly into that bottom quintile.
We understand the concerns about small cap performance amid a recession. Versus large caps, small caps often have more financial leverage, less-diversified business models, and shorter operational histories, all of which can contribute to higher failure rates. To mitigate these risks in the Causeway International Small Cap strategy, we include a suite of factors in our alpha model to measure a company’s potential resilience to economic weakness. We assess the strength of each company’s competitive moat by quantitatively evaluating long-term trends in market share, margins, returns, and balance sheet strength. We want to find companies with the pricing power, business models, and balance sheets to weather recessions and succeed in the long term.
In our view, the current multiple differences between small and mid/large caps present an attractive investment opportunity. In the past, when small caps traded at similar discounts, valuations did not remain depressed for long. We believe the highly idiosyncratic nature of small caps and the significant valuation dispersion observed make strong arguments for an actively managed approach.
This market commentary expresses Causeway’s views as of June 2023 and should not be relied on as research or investment advice regarding any stock. These views and any portfolio holdings and characteristics are subject to change. There is no guarantee that any forecasts made will come to pass. Forecasts are subject to numerous assumptions, risks, and uncertainties, which change over time, and Causeway undertakes no duty to update any such forecasts. Information and data presented has been developed internally and/or obtained from sources believed to be reliable; however, Causeway does not guarantee the accuracy, adequacy, or completeness of such information.
International investing may involve risk of capital loss from unfavorable fluctuations in currency values, from differences in generally accepted accounting principles, or from economic or political instability in other nations. For further information on the risks regarding investing in Causeway’s strategies, please go to https://www.causewaycap.com/wp-content/uploads/Risk-Disclosures.pdf
The Causeway international small cap strategy uses quantitative factors that can be grouped into six categories: valuation, earnings growth, technical indicators, competitive strength, macroeconomic, and country. The relative return attributed to a factor is the difference between the equally-weighted average return of the highest ranked quintile of companies in the strategy’s universe based on that factor and that of the lowest ranked quintile of companies. “Alpha” is a measurement of performance return in excess of a benchmark index.
The MSCI ACWI ex USA Index captures large and mid cap representation across 22 of 23 Developed Markets countries (excluding the US) and 24 Emerging Markets countries. With 1,856 constituents, the index covers approximately 85% of the global equity opportunity set outside the US. The MSCI ACWI ex USA Small Cap Index captures small cap representation across 22 of 23 developed markets (excluding the US) and 24 emerging markets. With 4,334 constituents, the index covers approximately 14% of the global equity opportunity set outside the US. The MSCI USA Index is designed to measure the performance of the large and mid cap segments of the US market. With 625 constituents, the index covers approximately 85% of the free float-adjusted market capitalization in the US. The MSCI USA Small Cap Index is designed to measure the performance of the small cap segment of the US equity market. With 1,890 constituents, the index represents approximately 14% of the free float-adjusted market capitalization in the US.
MSCI has not approved, reviewed, or produced this report, makes no express or implied warranties or representations and is not liable whatsoever for any data in the report. You may not redistribute the MSCI data or use it as a basis for other indices or investment products.