Contact Us
Subscribe to Causeway Insights, delivered to your inbox.
After dramatic performance divergence in the past year, undervaluation is currently much more prevalent in Europe and Japan than in the US. We examine the drivers of this valuation disconnect.
The Price of Popularity
Successful value managers are accustomed to taking unpopular positions. Their best investments frequently begin with unloved and underappreciated stocks that may face short-term challenges, either perceived or real. Over time, the issues are surmounted and the market’s discount fades. By the time those stocks become more universally embraced, it is probably time to sell. But sometimes entire regions gain or lose popularity. At Causeway, we approach the developed world as bottom-up analysts. Top-down considerations play a role in our investment process, but only insofar as they affect a specific company: How will macroeconomic conditions impact sales and profitability of an individual stock in the foreseeable future? After incorporating various scenarios and valuation methodologies, is this stock still undervalued? And based upon the answers to these types of questions, we may be drawn to or away from geographies that exhibit more or fewer attractive value opportunities.
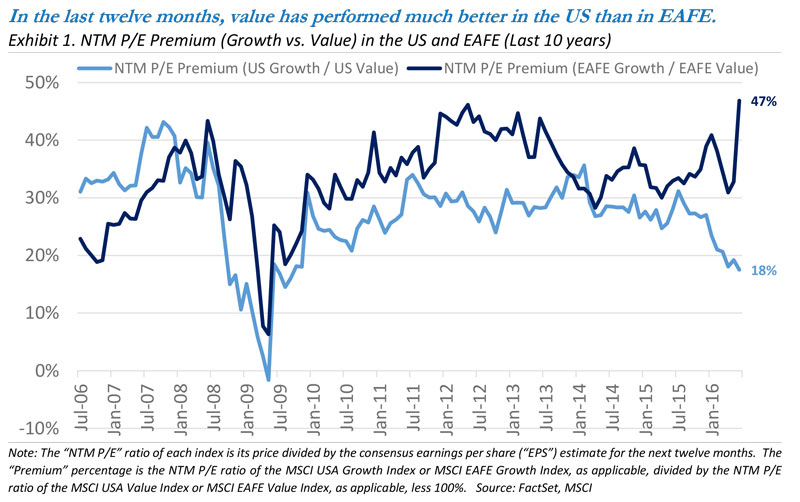
Such has been the case for the past twelve months. Even before the Brexit vote on June 23, we witnessed a significant divergence in the relative performance of value stocks in the United States versus value stocks within Europe and Japan, the largest constituents of the MSCI EAFE Index (“EAFE Index”). In the US, value stocks have generally “re-rated” upward while growth stocks “de-rated” downward. However, in the EAFE Index, value stocks have struggled and are trading at a much larger (and widening) discount to growth stocks. Exhibit 1 reveals that from a forward price-to-earnings (“P/E”) perspective, as of June 30, 2016, growth stocks trade at an 18% premium to value stocks in the US, but growth stocks trade at a 47% premium to value stocks across the EAFE Index Universe.

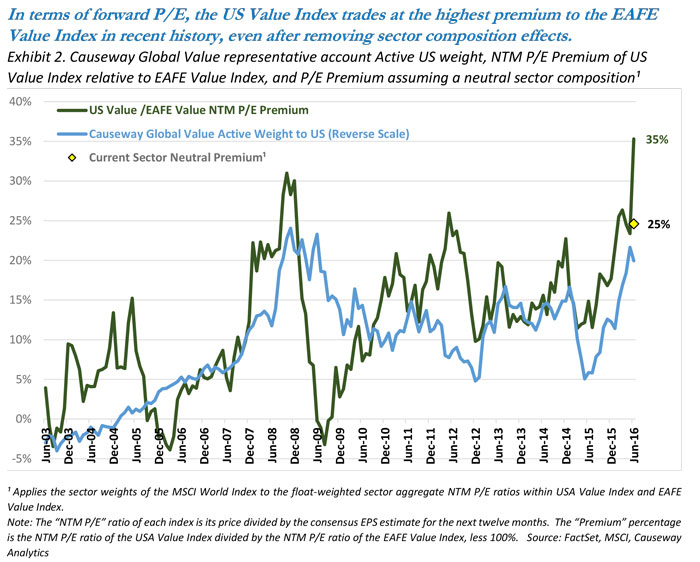
With a pure bottom-up approach to developed markets, we will naturally “follow” value to geographies in which it is most attractive. After the dramatic performance divergence in the past year, undervaluation is now much more prevalent in Europe and Japan than in the US. The dark green line in Exhibit 2 plots the valuation premium of the MSCI USA Value Index (“US Value Index”) relative to the MSCI EAFE Value Index (“EAFE Value Index”) over time. As of the end of June 2016, this premium stood at 35%. In the same chart, the blue line plots the active underweight of the US (versus the MSCI World Index) within a representative account using Causeway’s Global Value Equity strategy. A high correlation of 0.56 between the two lines demonstrates that, the more richly valued the US market, the lower our exposure. We actively seek to fill the portfolio with the best absolute value opportunities wherever they arise, and in the current environment, we are finding more attractive valuations outside of the US. Previous points in time when the US valuation premium exceeded 20% were quickly followed by reversions to premiums much closer to the long-term average of 12% (Note: Inception of the MSCI forward P/E data series is 2003).

What about differences in sector composition? Relative to the EAFE Value Index, the US Value Index has more weight in Information Technology and Consumer Staples, while it has less weight in Financials. If we apply the sector weights of the MSCI World Index to both the US Value Index and EAFE Value Index, we find that composition explains only part of the premium. The yellow diamond in the chart above represents this “sector neutral” premium. At 25%, it also sits at an all-time high (matched once before in December 2003) and compares to an average of 7% since 2003. We believe that this sector-neutral premium may likely be even closer to zero over a longer period of history.
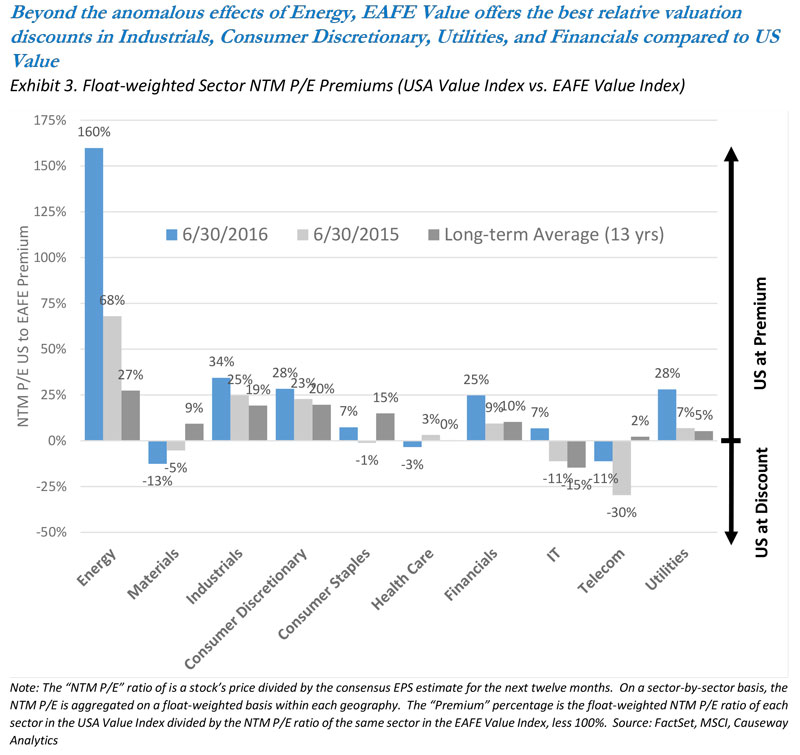
For those curious about which sectors trade with the largest valuation disconnect, Exhibit 3 plots the forward P/E multiple premium for each sector in the US Value index relative to the EAFE Value Index. The current premium is displayed relative to the premium as of June 30, 2015 and the long-term average since 2003. In 8 out of the 10 sectors, this premium has increased from June 2015. Energy stands out from the others and is largely explained by the high proportion of Exploration & Production (“E&P”) companies in the US Energy sector and the larger presence of upstream activities within the largest stocks (Exxon Mobil and Chevron). Earnings for these stocks have collapsed in the past couple of years leading to much higher P/E multiples. Aside from the energy sector, the largest regional valuation premiums currently reside in the Industrials, Consumer Discretionary, Utilities, and Financials sectors.

If sector composition does not explain all of the current valuation differential between the US Value and EAFE Value Indices, then what does? Most arguments gravitate around perceived differences in stability, growth potential or returns on equity. Investors may deem the US to be a “safer” place to invest to avoid any “tail” risks in Europe or Japan. A gap in the expected earnings growth rates may also explain part of the differential. According to MSCI, the long-term earnings growth (LTG) estimate for stocks in the US Value Index was 8.0% as of June 30, 2016 while the same estimate for stocks in the EAFE Value Index was 5.1%. Finally, the trailing 12-month return on equity (ROE) for stocks in the US Value Index was 9.9% compared to 6.8% for stocks in the EAFE Value Index. Despite the allure of these explanations, however, regression analysis fails to uncover consistent and statistically significant relationships among these variables historically.
While some differential may be appropriate, active managers have a chance to prove their worth when the market indiscriminately becomes excessively optimistic or pessimistic about a geographic region without considering the unique prospects for individual companies. Causeway seeks out stocks that we believe have been unfairly penalized by market reaction and that deserve to trade at higher valuations, even after discounting their growth, earnings, and risk profiles. Stocks that ultimately make it through our in-depth investment process represent the investments we believe have the highest risk-adjusted return potential. Currently, we believe the historically wide discount assigned to non-US international markets is not supported by fundamentals, and provides a compelling opportunity for clients in our value strategies.
Solely for the use of institutional investors and professional advisers.
This presentation expresses the authors’ views as of July 29, 2016 and should not be relied on as research or investment advice regarding any investment. These views and any portfolio characteristics are subject to change. There is no guarantee that any forecasts made will come to pass.
“Correlation” ranges between -1 and +1. Perfect positive correlation (+1) implies that as the index moves up or down, the strategy will move in the same direction. Perfect negative correlation (-1) means the strategy will move in the opposite direction. A correlation of 0 means the index and strategy have no correlation.
The MSCI EAFE Index (Europe, Australasia, Far East) is a free float‐adjusted market capitalization index that is designed to measure the equity market performance of developed markets, excluding the US & Canada.
The MSCI USA Index is designed to measure the performance of the large and mid-cap segments of the US market. With 622 constituents, the index covers approximately 85% of the free float-adjusted market capitalization in the US.
The MSCI EAFE Value and MSCI USA Value Indices are subsets of these indices, and target 50% coverage of the MSCI EAFE Index and MSCI USA Index, respectively, with value investment style characteristics for index construction using three variables: book value to price, 12-month forward earnings to price, and dividend yield. The MSCI EAFE Growth Index and MSCI USA Growth Index are also subsets of these indices, with growth investment style characteristics for index construction using five variables: long-term forward earnings per share growth rate, short-term forward earnings per share growth rate, current internal growth rate and long-term historical earnings per share growth trend and long-term historical sales per share growth trend.
The MSCI World Index is a free float-adjusted market capitalization index, designed to measure developed market equity performance, consisting of 23 developed country indices, including the US
The Indices are gross of withholding taxes, assume reinvestment of dividends and capital gains, and assume no management, custody, transaction or other expenses.
MSCI has not approved, reviewed or produced this report, makes no express or implied warranties or representations and is not liable whatsoever for any data in the report. You may not redistribute the MSCI data or use it as a basis for other indices or investment products.
It is not possible to invest directly in an index.
