


Contact Us
Subscribe to Causeway Insights, delivered to your inbox.
AI is accelerating business disruption across industries. As capabilities advance and competitive advantages shift, once-insulated business models are being challenged while effective adopters strengthen their positions. Active investors must judge where disruption will occur, how quickly, and where portfolios are exposed to the risks and opportunities. This is especially difficult across hundreds of companies, sectors, countries, and market capitalizations where disruption may manifest differently in each competitive landscape. To address these challenges, Causeway developed an AI Business Disruption Risk factor. Built from the ongoing work of our fundamental research analysts and scaled through quantitative methods, the framework translates company-specific research into a consistently monitored risk factor across our investable universe. It is designed to identify emerging AI risks, compare portfolios with benchmarks, and assess changing competitive dynamics.
Key insights
- AI is redrawing competitive landscapes across industries.
- Causeway's eight-factor model aims to separate AI resilience from disruption.
- Fundamental research informs systematic portfolio monitoring.
Factor Model Development
Causeway fundamental analysts assess how AI may reshape companies we own and follow. We cataloged sector-specific risks and opportunities—from lower auto-insurance claims frequency to higher data-center power demand to labor substitution in business-process outsourcing—and grouped them into four AI disruption archetypes:
- AI beneficiaries (best case): AI expands the total addressable market (TAM)—the maximum revenue opportunity for a service or product—or rate base or improves cost competitiveness.
- Margin pass-through: AI lowers costs, but competition passes the savings to customers.
- Value-chain migration: AI reallocates economic value within an industry, shifting profits from incumbents to AI-native platforms, intermediaries, or software providers.
- Terminal TAM shrinkage (worst case): AI permanently reduces the total addressable market.
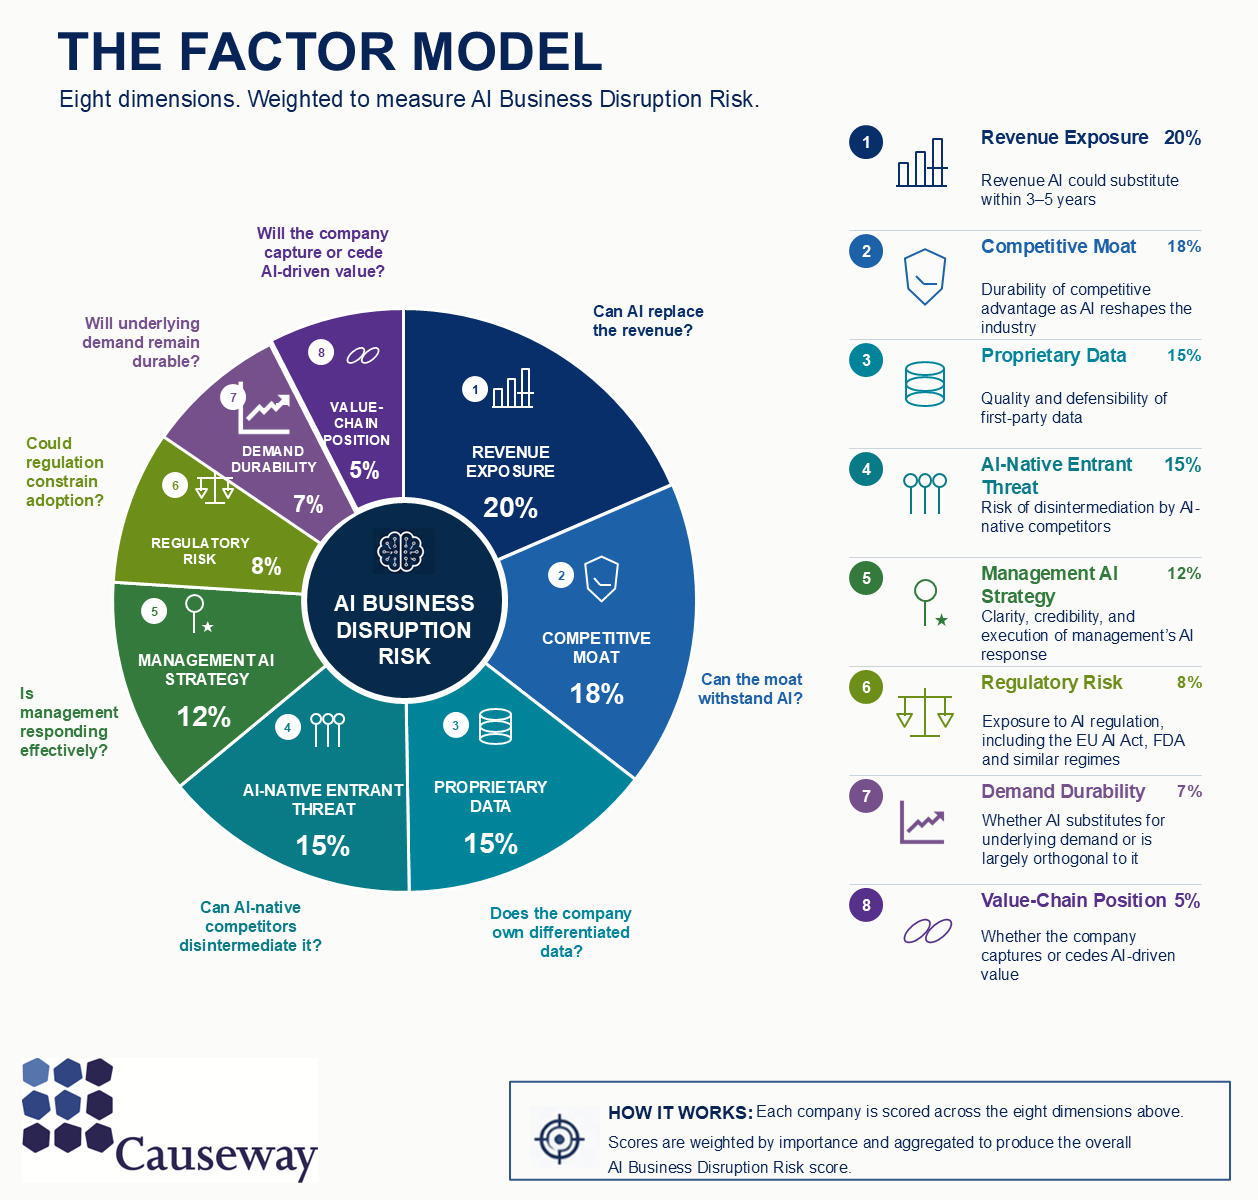
Causeway quantitative analysts translated recurring judgments on revenue exposure, moats, management response, and more into eight cross-sector dimensions. LLM and NLP models score the investable universe using internal and broker research, filings, earnings call transcripts, and news; fundamental analysts validate the results. Weights reflect how directly and quickly we believe each dimension can impair the business model.
Each dimension is rated from 1 (low risk) to 5 (high risk) and combined into a weighted 0-100 AI Business Disruption Risk score. Because the score is derived from weighted 1-5 ratings rather than a percentage scale, portfolio and industry averages typically fall well below 50. Scores approaching 60 represent exceptionally high disruption risk.
How Do Global Industry Groups Stack Up?
We assessed float-weighted AI disruption risk across MSCI ACWI Index industry groups. Software, autos, banks, and insurance score highest, reflecting their greater exposure to AI-driven disruption, while more insulated sectors—including materials, energy, utilities, semiconductors, and consumer goods—score lowest.
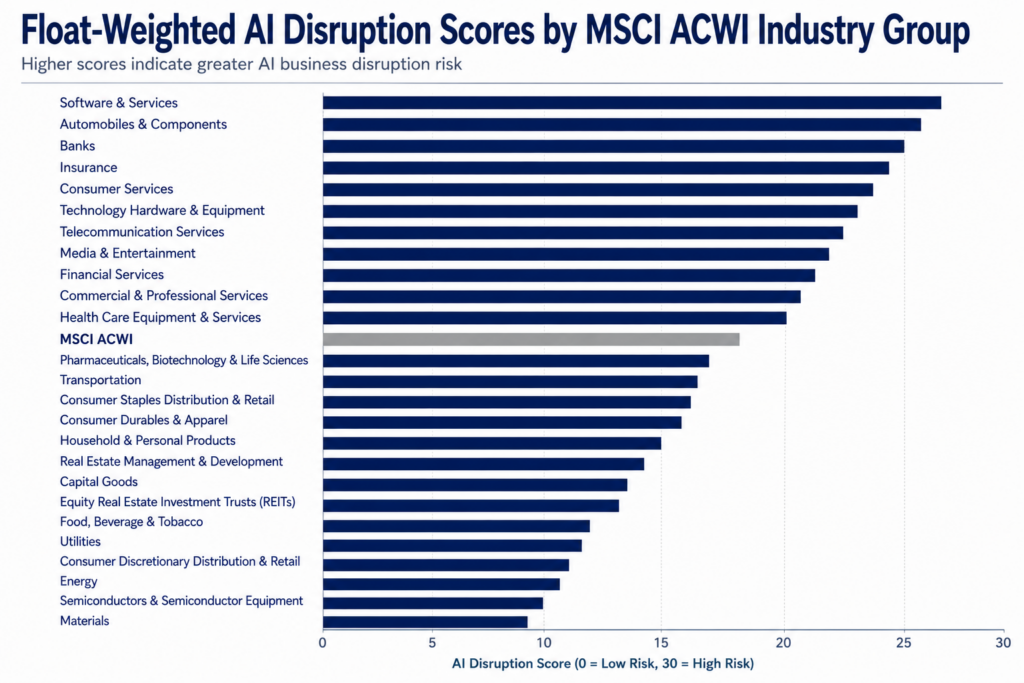
Scores are weighted AI Business Disruption Risk scores, not percentages. Because they represent weighted averages across many companies, industry scores generally range from approximately 10-30. The MSCI ACWI currently scores about 18, while company-specific scores can be substantially higher.
Case Study: Teleperformance SE
Within Causeway’s International Small Cap strategy, the model flagged a well-known European business services company, Teleperformance SE, with an AI Business Risk Disruption score of 60/100—an exceptionally high score and among the highest we expect to observe in practice. The company’s risk profile aligned with two of the AI disruption archetypes defined earlier: Terminal TAM Shrinkage and Value-Chain Migration.
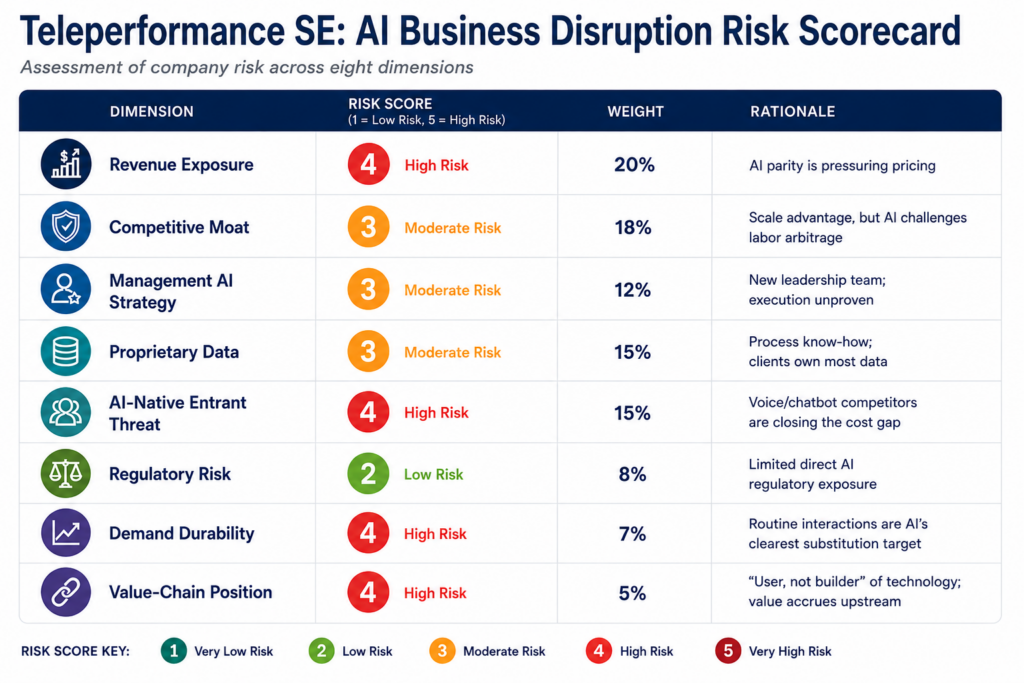
The model confirmed three concerns already highlighted by our fundamental analysts: AI alternatives were nearing offshore-labor cost parity; the moat was operational, not proprietary; and AI value accrues upstream. The stock’s multiple de-rating indicated the market had reached the same conclusion. With this information, we sold the stock.
From Stock Score to Risk Factor
We aggregate company scores at the portfolio level to monitor AI disruption exposure and compare each strategy with its benchmark. At the end of the second quarter, Causeway’s international, global and emerging markets portfolios generally had relatively low risk, with exposures near the MSCI EAFE, ACWI, and Emerging Markets indices.
With this model, every portfolio holding and prospective holding will carry a live AI Business Disruption score. Our framework spans sectors: the same eight dimensions apply whether we are evaluating a utility, bank, pharmaceutical company or business process outsourcer. We aim to track sector-level red flags and trigger events systematically, including events such as autonomous vehicle adoption, AI-designed biologics, and agentic commerce adoption, and monitor active exposure against the relevant index. The monitored factor will be available to Causeway quantitative and fundamental research to inform ongoing research and portfolio discussions.
AI-driven disruption will continue to reshape competitive dynamics across industries. Causeway’s AI Business Disruption Risk factor aims to transform fundamental insights into a scalable quantitative monitoring framework, for a current view of emerging risks and opportunities across companies, portfolios, and benchmarks.
This market commentary expresses Causeway’s views as of July 2026 and should not be relied on as research or investment advice regarding any stock. The views herein represent an assessment of companies at a specific time and are subject to change. There is no guarantee that any forecast made will come to pass. This information should not be relied on as investment advice and is not a recommendation to buy or sell any security. The securities identified and described do not represent all of the securities purchased, sold, or recommended for client accounts. Our investment portfolios may or may not hold the securities mentioned. The reader should not assume that an investment in the securities identified was or will be profitable. For full performance information regarding Causeway’s strategies, please see www.causewaycap.com. For further information on the risks regarding investing in Causeway’s strategies, please go to https://www.causewaycap.com/wp-content/uploads/Risk-Disclosures.pdf.
The MSCI ACWI Index is a free float-adjusted market capitalization index, designed to measure the equity market performance of developed and emerging markets, consisting of 23 developed country indices, including the U.S., and 24 emerging market country indices.
The MSCI Emerging Markets Index is a free float-adjusted market capitalization index, designed to measure equity market performance of emerging markets, consisting of 24 emerging country indices.
The MSCI EAFE Index is an equity index which captures large and mid cap representation across Developed Markets countries around the world, excluding the US and Canada. The index covers approximately 85% of the free float-adjusted market capitalization in each country.
MSCI has not approved, reviewed, or produced this report, makes no express or implied warranties or representations and is not liable whatsoever for any data in the report. You may not redistribute the MSCI or S&P Global data or use it as a basis for other indices or investment products.
