Contact Us
Subscribe to Causeway Insights, delivered to your inbox.
One of the most critical responsibilities of the active value investor is determining why a stock is trading at a low multiple of near-term earnings relative to the market or peers. There are many acceptable reasons – including short-term cyclical, restructuring, and operational challenges – and then there is one answer that is typically not acceptable – intractable structural problems. Stocks of companies and industries facing significant structural pressures or structural declines are unlikely to rerate upward since the market will ascribe a negligible terminal value to the business. Multiples of these stocks are low and will remain low, and they may even face existential threats in extreme circumstances.
Weeding out stocks with structural problems ties in very closely with the theoretical underpinnings of the value premium itself. The typical risk-based explanation for the value premium goes something like this: Value companies are risky because they face uncertain futures, and thus value investors should be rewarded with higher-than-market returns for assuming this risk. Though these prescribed higher returns have remained stubbornly elusive in recent years, value’s risk-based explanation seems as valid as ever, especially during the COVID-related market volatility. 2020 has been a year of extreme changes in assumptions and paradigms as analysts abruptly shift their views of the post-COVID world. Separating the long-term winners from the long-term losers in this new world is essential.
Examining the competitive structure of industries is one way to do this. More than four decades ago, Harvard Business School Professor Michael Porter first identified “five forces” that shape industrial competition: the threat of new entrants, the bargaining power of buyers, the bargaining power of suppliers, the threat of substitute products or services, and the rivalry among existing competitors.[1] He argued that a thorough analysis of how these forces impact competition would provide insight into an industry’s profit potential. However, competition is never static, so in addition to these point-in-time characteristics, we should also be aware of structural changes underway – perhaps as a result of technological change or disruption – that might impact the future prospects of an industry.
Key insights
- An industry’s competitive landscape and a company’s position within it have been closely linked to changes in profitability and, ultimately, a stock’s return potential.
- As assumptions about the future swiftly change to adapt to the COVID-era reality, assessing competitive strength is perhaps more important than it has ever been.
- In this note, we discuss Causeway’s proprietary competitive strength framework that we believe addresses some of these important issues and aids in stock selection.
Relative industry returns in recent years make it clear why competitive dynamics matter so much. The Global Industry Classification Standard (GICS) sorts all public companies into 69 industries based on their principal line of business. In Exhibit 1, we evaluate the relative return and volatility statistics for the top and bottom five industries sorted by Sharpe Ratio over the last 10 years. The industries on this list probably will not surprise most market participants. Those at the bottom of the list include energy, airlines, and metals & mining, all industries characterized by lack of product differentiation, very little (if any) pricing power, significant competition, and fairly low barriers to entry. Those at the top of the list (software, IT services, health care) have more substantial competitive “moats” in the form of intellectual property, network effects, and switching costs. Industry structure and dynamics have inevitably played a prominent role in stock price performance.
Recent industry returns appear to be highly related to industry structure.
Exhibit 1. MSCI ACWI Index Top/Bottom 5 Industries Sorted by Sharpe Ratio (Last 10 Years)
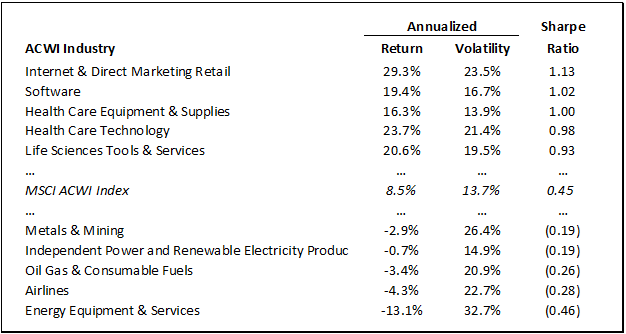
Note: All 69 GICS industries in the MSCI ACWI Index are sorted based on realized Sharpe Ratio from October 31, 2010 to October 31, 2020 using gross, unhedged index returns. The table above includes the industries with the highest five and lowest five Sharpe Ratios. Sharpe Ratio is a measure of risk-adjusted performance that divides the average return minus the risk-free return by the standard deviation of those excess returns (returns above the risk-free return). Sharpe Ratio calculation assumes monthly implied 10-Year U.S. Treasury yields as the risk-free return. Source: FactSet, MSCI, Causeway Analytics
Initially inspired by Porter’s Five Forces, Causeway sought to build a framework to quantify competitive strength. While staying true to our value philosophy, we recognized that stocks in especially strong and sustainable competitive positions may deserve to trade at a valuation premium to the market. In our development process, we also aimed to expand on Porter’s initial framework along two dimensions. First, rather than accept a static snapshot of industry structure, we wanted to capture changes over time to measure how well (or not) an industry is embracing technological change. And second, we wanted to consider an individual company’s position in the broader framework. As stock pickers, we need to understand if a company’s figurative “star” is rising or falling within an industry to seek to gauge its profitability and return potential.
We ultimately developed a model that examines current levels and expected trends in a broad range of metrics relevant to competitive strength: margins, returns, competition, industry structure, market share, and balance sheet strength. We include some top-down, industry-wide assessments regarding competitive intensity, however most of the metrics are company-specific. Nevertheless, we can easily aggregate company scores to the industry level on a float-weighted basis to gauge the relative strength of each industry. In Exhibit 2, we observed those industry-level scores as of October 31, 2010 and compared it to that industry’s Sharpe Ratio over the subsequent 10 years. The two variables share a 0.58 correlation, indicating that those industries with the most robust competitive dynamics went on to deliver the strongest risk-adjusted returns (and vice versa).
High correlation between Competitive Strength score and subsequent Sharpe Ratio.
Exhibit 2. Correlation between Causeway Competitive Strength Score and Subsequent Sharpe Ratio
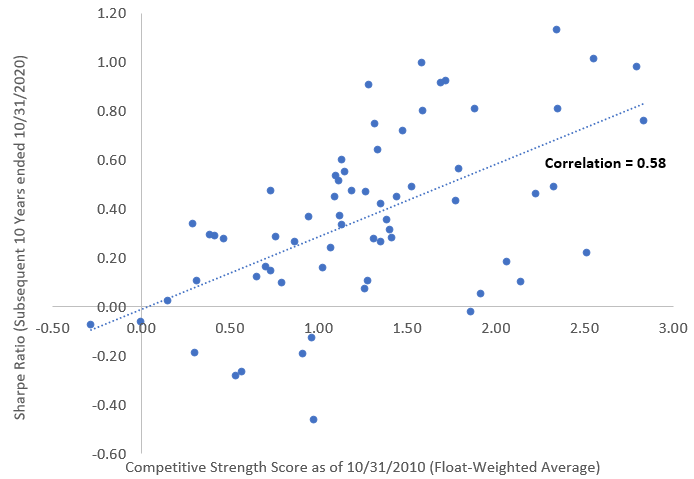
Note: Each data point represents a GICS industry within the MSCI ACWI universe. The x-axis plots an industry’s float-weighted average Causeway Competitive Strength score as of October 31, 2010, and the y-axis plots that industry’s float-weighted realized Sharpe Ratio from October 31, 2010 to October 31, 2020 using gross, unhedged industry index returns. Sharpe Ratio calculation assumes monthly implied 10-Year U.S. Treasury yields as the risk-free rate. Source: Causeway Analytics, FactSet, MSCI
However, armed with our competitive strength scores, we believe we can do better than simply choosing one industry over another. Participants in the same industry may have markedly different attributes. The best operators will be steadily gaining share, increasing margins, and growing returns on capital. In the current “winner-take-all” market where the big keep getting bigger, we want to identify the strongest players in the strongest industries. Those stocks with durable competitive “moats” should trade at higher multiples since they will likely be able to maintain and grow profitability with lower volatility in earnings.
In the current “winner-take-all” market where the big keep getting bigger, we want to identify the strongest players in the strongest industries.
To confirm this theory historically, we sorted the constituents of the MSCI ACWI and Emerging Markets Indexes by their Causeway Competitive Strength scores at the end of every month starting on October 31, 2010 (10 years ago as of the date of this newsletter). We then tracked the performance of four quartile groups over the following month and rebalanced at each subsequent month end. The return characteristics of each quartile are shown in Exhibits 3 and 4. The quartile results in both universes demonstrate largely consistent trends in return, volatility, and Sharpe ratio. In both cases, the standout performer was the top quartile of stocks sorted by Competitive Strength, which produced returns well above those of the next quartile down and with lower volatility.
The top quartile of stocks sorted by Competitive Strength outperformed all other quartiles.
Exhibit 3. MSCI ACWI Index Universe Sorted by Competitive Strength Quartile
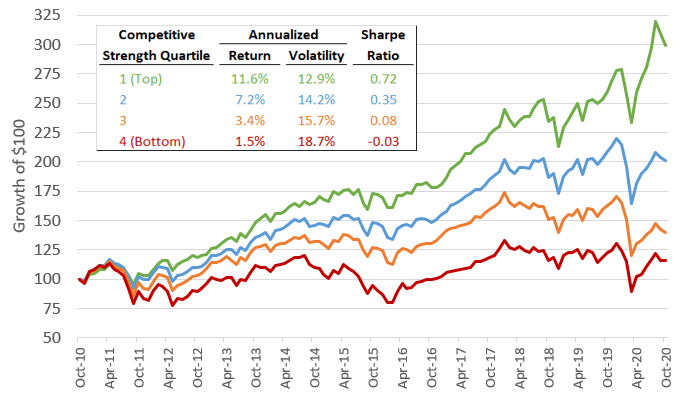
Exhibit 4. MSCI Emerging Markets Index Universe Sorted by Competitive Strength Quartile
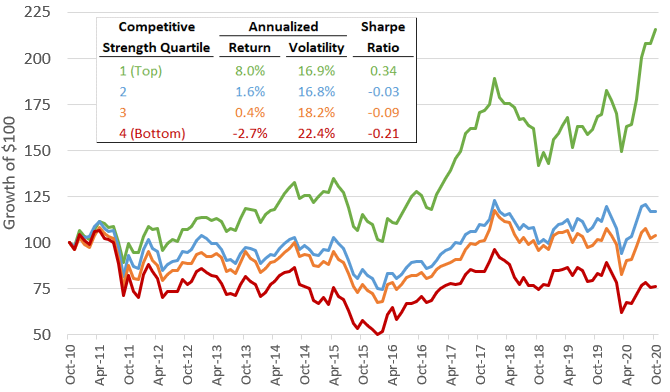
Note: Stocks sorted into quartiles by Causeway Competitive Strength score at the end of each month beginning October 31, 2010 and float-weighted performance tracked for the following month, rebalancing monthly. Universes are the MSCI ACWI Index (Exhibit 3) and MSCI Emerging Markets Index (Exhibit 4). Data through October 31, 2020. Sharpe Ratio calculation assumes monthly implied 10-Year U.S. Treasury yields as the risk-free return. Note that Causeway does not manage portfolios based solely on Competitive Strength scores. See disclosures at the end of this presentation for further information. Source: Causeway Analytics, FactSet, MSCI
We can see from Exhibits 3 and 4 that segmenting the universe of stocks by our Causeway Competitive Strength Score would have proven very effective over the last 10 years. Stocks with the strongest competitive metrics have significantly outperformed those with the weakest competitive attributes. Because we want to capture both the industry structure and a company’s positioning within it, our scores do not neutralize by sector or industry when constructing this score. However, there were only very slight persistent sector overweights and underweights in these quartiles over this period; the vast majority of return differential came from competitive differentiation within each sector.
Competitive strength is particularly important to us as value investors. Cheap stocks will only rerate upward if the drivers of their initial derating are, in fact, temporary. A contrarian strategy cannot succeed if it leads to investing in structurally-damaged companies. Incorporating competitive strength in our investment process is one potential safeguard against buying stocks with business models that are fundamentally broken. Companies that have improving margins and returns that compete in industries with rational competition are unlikely to be value traps. Given our encouraging results, we have recently begun to include competitive strength metrics in screens for our fundamental strategies, and we are planning to add these metrics as alpha signals for our quantitative strategies.
Despite the enormous headwind that value strategies have faced in recent years, we find that competitive strength provides a framework to weed out stocks with declining financial performance and improve performance relative to benchmarks.
Despite the enormous headwind that value strategies have faced in recent years, we find that competitive strength provides a framework to weed out stocks with declining financial performance and improve performance relative to benchmarks. In Exhibits 5/6, we compare the recent performance of the top half of the ACWI/Emerging Markets Value Index sorted by competitive strength to the bottom half of the corresponding Growth Index. Even with this very rough cut, we observe that the “better” half of the relevant Value Index has actually outperformed the “weaker” half of the relevant Growth Index. For comparison, over this same time period, the MSCI ACWI Value Index underperformed the MSCI ACWI Growth Index by 6.0% annually, and the MSCI Emerging Markets Value Index underperformed the MSCI Emerging Markets Growth Index by 5.8% annually.
Value’s top half of stocks sorted by Competitive Strength outperformed Growth’s bottom half.
Exhibit 5. MSCI ACWI Value and Growth Indices Sorted into Halves by Competitive Strength
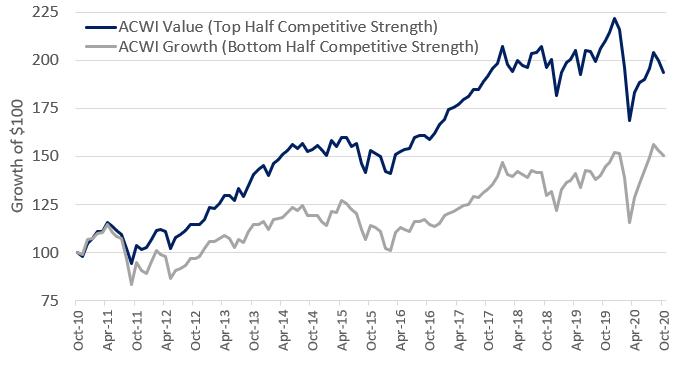
Exhibit 6. MSCI Emerging Markets Value and Growth Indices Sorted into Halves by Competitive Strength
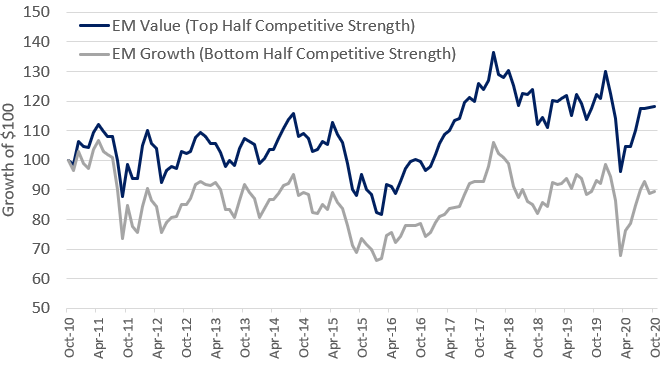
Note: Stocks sorted into halves by Causeway Competitive Strength score at the end of each month beginning October 31, 2010 and float-weighted performance tracked for the following month, rebalancing monthly. Universes are the MSCI ACWI Value Index/MSCI ACWI Growth Index (Exhibit 5) and the MSCI Emerging Markets Value Index/MSCI Emerging Markets Growth Index (Exhibit 6). Data through October 31, 2020. Source: Causeway Analytics, FactSet, MSCI
In a year of such rapid shifts in assumptions about the future, paying attention to industry structure and a company’s competitive position within it is particularly important, especially for the value investor. At Causeway, we have developed a competitive strength framework that evaluates a firm’s changing margins, returns, industry structure, market share, and balance sheet strength. Inexpensive valuations are still a prerequisite for investment, but considering competitive strength seeks to provide an extra margin of safety. We believe it will allow us to focus our attention on those value stocks whose competitive fundamentals are strong and are most likely to rerate upward in the future.
[1] In his 1979 Harvard Business Review article, “How Competitive Forces Shape Strategy,” and subsequent 2008 article, “The Five Competitive Forces That Shape Strategy,” Professor Michael Porter detailed his “five forces” framework to help analyze industry competition and determine the relative attractiveness of an industry.
This market commentary expresses Causeway’s views as of November 2020 and should not be relied on as research or investment advice regarding any stock. These views and any portfolio holdings and characteristics are subject to change. There is no guarantee that any forecasts made will come to pass. Forecasts are subject to numerous assumptions, risks and uncertainties, which change over time, and Causeway undertakes no duty to update any such forecasts. Information and data presented has been developed internally and/or obtained from sources believed to be reliable; however, Causeway does not guarantee the accuracy, adequacy or completeness of such information.
International investing may involve risk of capital loss from unfavorable fluctuations in currency values, from differences in generally accepted accounting principles, or from economic or political instability in other nations.
Historical information about Causeway’s Competitive Strength score is derived from back-tested data using a simulated process. Causeway does not currently manage assets using this process. There are numerous inherent limitations in the use of simulated information, including that it may not reflect the impact that material economic and market factors might have had on the portfolio managers’ decision making if they were actually managing accounts using that process. The simulated information does not reflect contemporaneous trading or any transaction costs. Simulated information may not be indicative of the future returns of any portfolio.
The MSCI ACWI Index is a free float-adjusted market capitalization index, designed to measure the performance of the large and mid-cap segments across 23 Developed Markets and 26 Emerging Markets countries. The MSCI ACWI Value Index is a subset of the MSCI ACWI Index, and targets 50% coverage of the MSCI ACWI Index, with value investment style characteristics for index construction using three variables: book value to price, 12-month forward earnings to price, and dividend yield. The MSCI ACWI Growth Index is a subset of the MSCI ACWI Index and targets the remaining 50% coverage.
The MSCI Emerging Markets Index is a free float-adjusted market capitalization index, designed to measure equity market performance of emerging markets across 26 Emerging Markets countries. The MSCI Emerging Markets Value Index is a subset of the MSCI Emerging Markets Index, and targets 50% coverage of the MSCI Emerging Markets Index, with value investment style characteristics for index construction using three variables: book value to price, 12-month forward earnings to price, and dividend yield. The MSCI Emerging Markets Growth Index is a subset of the MSCI Emerging Markets Index and targets the remaining 50% coverage.
These MSCI indices are gross of withholding taxes, assume reinvestment of dividends and capital gains, and assume no management, custody, transaction or other expenses. It is not possible to invest directly in an Index.
MSCI has not approved, reviewed or produced this report, makes no express or implied warranties or representations and is not liable whatsoever for any data in the report. You may not redistribute the MSCI data or use it as a basis for other indices or investment products.