Contact Us
Subscribe to Causeway Insights, delivered to your inbox.
“Sometimes you gotta say, ‘What the [heck], make your move.’” - Miles Dalby, Risky Business
Five years ago, Causeway made its move–offering online access to its proprietary risk model. The cloud application, called “Risk Lens,” is free for institutional investors and advisers. We asked Causeway’s co-founder, Sarah Ketterer, portfolio manager, Joe Gubler, and Risk Lens COO, Turner Swan, for their perspectives after five years online.
Joe, what problem does Risk Lens address?
JG: Initially, we had an internal problem. Causeway manages institutional client portfolios fusing fundamental and quantitative analysis, and one of our tenets is that “risk matters.” You cannot just look at performance, but risk and returns are inextricably linked and returns are ultimately the compensation for accepting uncertainty. We risk-manage our strategies carefully and constantly monitor portfolios with our proprietary risk model. The risk model, designed by our portfolio managers, is multi-factor and basically derives expected stock returns after assessing predicted risk exposures. It was – and is – a powerful tool for analyzing Causeway’s managed portfolios.
The problem, though, was that we wanted to use the same predicted risk analysis to compare our portfolios to other managers. This would help us better assess Causeway versus peers and help us manage portfolios and communicate portfolio positioning more effectively with clients. But the risk model did not have access to other managers’ portfolio holdings.
SHK: To fix this, we designed Risk Lens to apply elements of our risk model to other managers’ portfolios, as well as our own portfolios. We obtained the portfolio data by accessing the latest publicly available holdings of equity mutual funds, and back in 2013 we created the initial version of Risk Lens on manual Excel spreadsheets for internal use and to show clients.
As time went on, we realized that other institutional investors and fiduciaries had the same problem. They needed to know the key predicted risk exposures of their portfolios, and they needed to be able to compare these metrics to other managers.
JG: That’s when we realized we could share our risk model, through Risk Lens, directly with clients and other institutional investors. So in 2019 we “made our move” and provided independent online access to a broad institutional universe. Now Risk Lens is our proprietary analytics tool that provides key equity portfolio risks, predicted active return correlations (PARCs), ESG scores, and fund screening. It’s in the cloud and users can get access through their mobile devices or anywhere they have an internet connection. We want our clients and the adviser community to have easy frictionless access via the cloud, so Risk Lens is free to use and requires no subscription agreement.
TS: For key risks, the tool analyzes the current holdings of a portfolio and shows predicted risk exposures and how much they contribute to tracking error. Among others, we show predicted volatility, predicted beta, predicted tracking error, and more. Risk Lens also provides style exposures, ESG scores, diversification ratios, active share, and geographic, sector, currency and market cap exposures. We like to emphasize, “know your portfolio.” Risk Lens helps a user look deep into a portfolio and when we look at risks, we are looking at recent holdings and generating predicted risks. This helps asset managers align predicted equity portfolio risk with their clients’ risk levels.
Joe, what does the Risk Lens output look like?
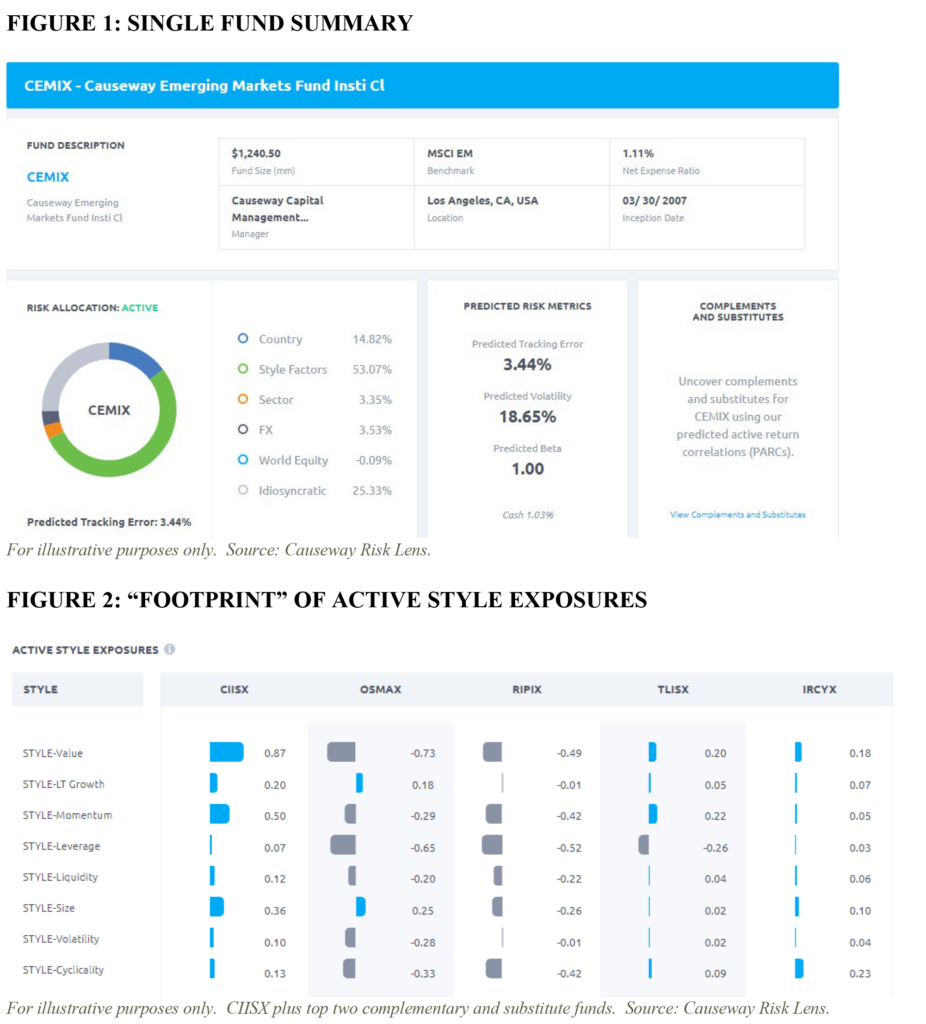
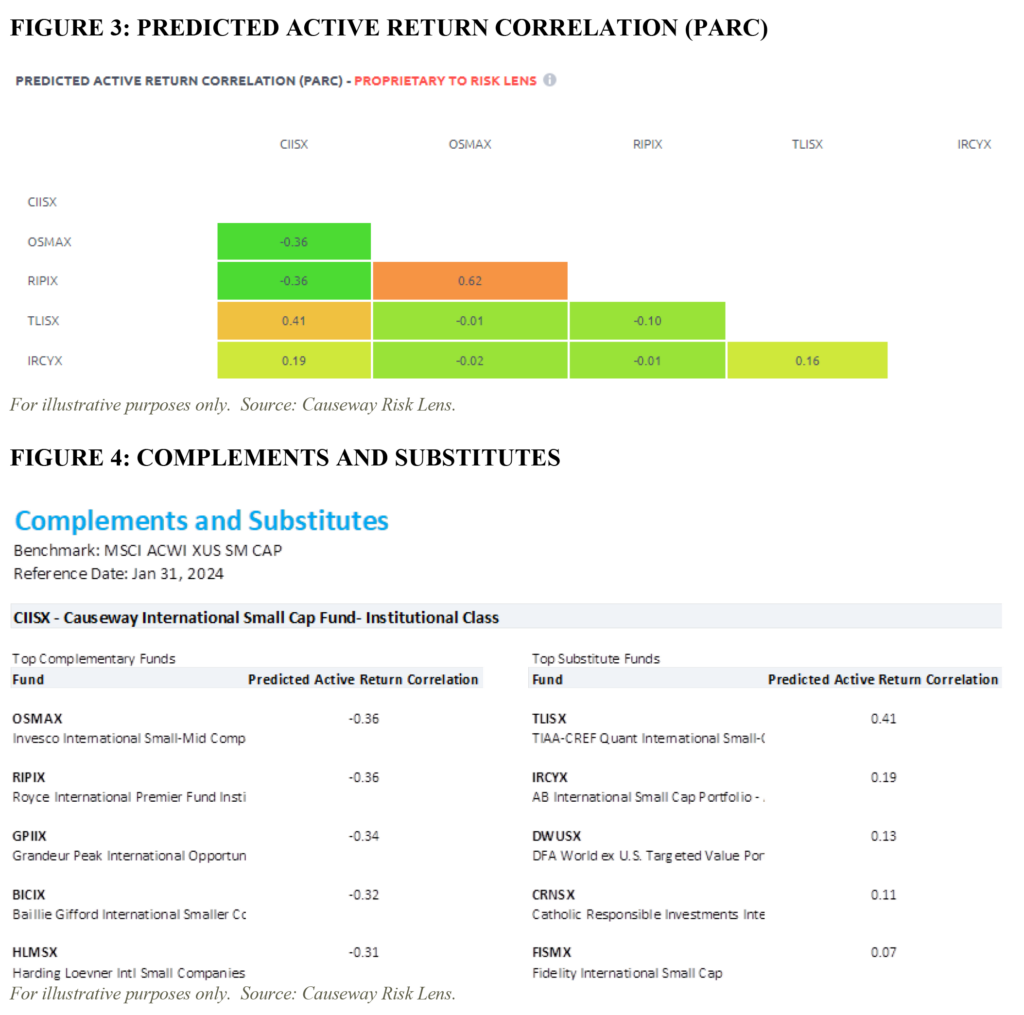
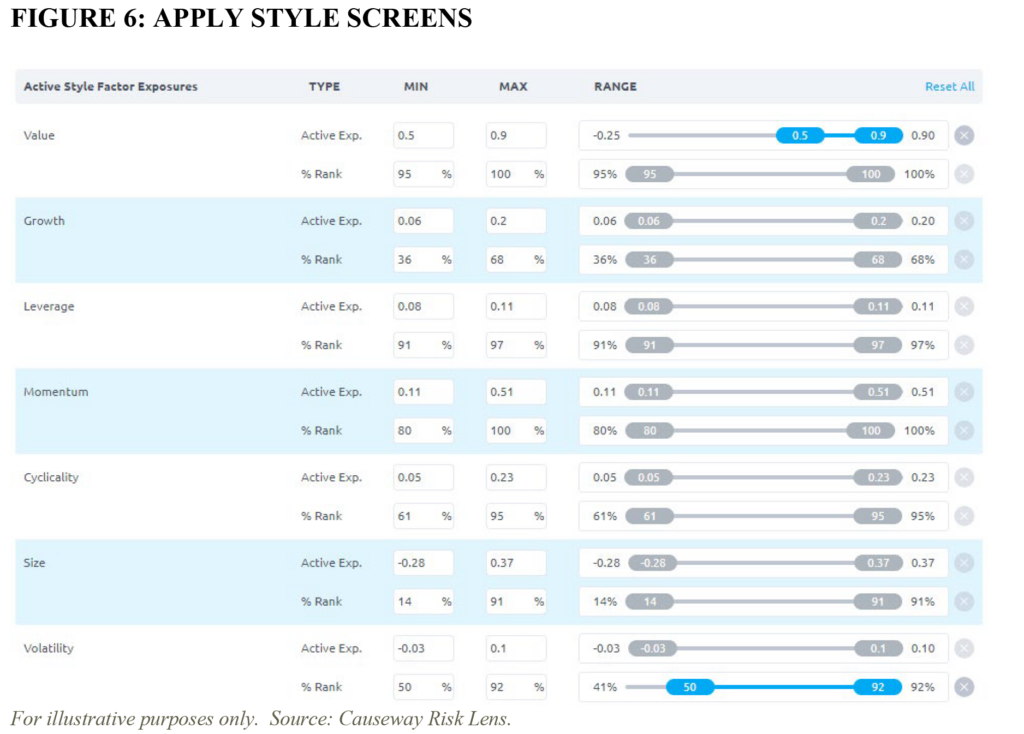
JG: Figure 1 is an example of a single fund summary, with a pie chart showing top risk allocations, and also predicted tracking error, volatility, and beta. At a given point in time, funds will have distinctive risk “footprints” and Figure 2 is an example of a style risk footprint. The graph is part of a comparative fund analysis report that shows active style exposures based on current portfolio holdings of four compared funds. At a glance, you can see the funds with more (blue) or less (gray) exposure to a style factor than the benchmark. To calculate style exposures, securities are “z-scored” on each of the eight style dimensions. The standardized z-scores range from +3 to -3, with a score of 0 being equal to the weighted average score across the universe, +3 being most representative of the style, and -3 being least representative of the style. Fund style exposures are the weighted average of the style scores of fund holdings. Active style exposures measure the difference between fund style exposures and benchmark style exposures.
Turner, why does Causeway offer Risk Lens and who uses it?
TS: As Sarah noted, Risk Lens is first and foremost a tool for our clients, and we see Risk Lens as a way to further partner with clients. It offers users direct access to our proprietary risk model to analyze their own portfolios, as well as the thousands of equity funds in Risk Lens’ universe. In addition to client service, Causeway will provide Risk Lens analysis to certain prospective clients so they can use Risk Lens themselves to evaluate and compare competitors in manager searches. We also believe Risk Lens showcases Causeway’s risk management prowess and generally helps promote Causeway’s brand to a broad institutional universe.
JG: As a portfolio manager, before going into a search presentation, I typically run Risk Lens comparing our Causeway strategy to competitors. If we don’t know our specific competitors, I’ll use Fund Screener in Risk Lens to screen the relevant benchmark universe and show the range of risk characteristics and top performers to help us understand how Causeway compares to peers. I’ll also often use our predicted active return correlation (PARC) tool to review the predicted correlations of a group of funds with Causeway funds, or to show a single fund’s top complementary (low correlated) and substitute (high correlated) funds. Using Risk Lens helps me have more sophisticated conversations with clients about the portfolio we manage and how it compares and contrasts with other equity funds.
TS: Our top users include analysts at some of the largest asset management firms in the world, and most of our users are also clients or have clients invested with Causeway.
“Many asset managers talk about wanting to be a partner and extension of staff, and we believe Risk Lens is actually a tangible offering in that spirit.” Senior Investment Analyst, Large North American Asset Management Firm
Usage is growing. Since 2021, the number of external users has increased 136% and the number of external Risk Lens reports generated has grown 631%. We are pleased so far with the attention Risk Lens has generated. We also survey top users from time to time and add features based on their input.
Joe, how can asset managers avoid investing in funds that are too similar?
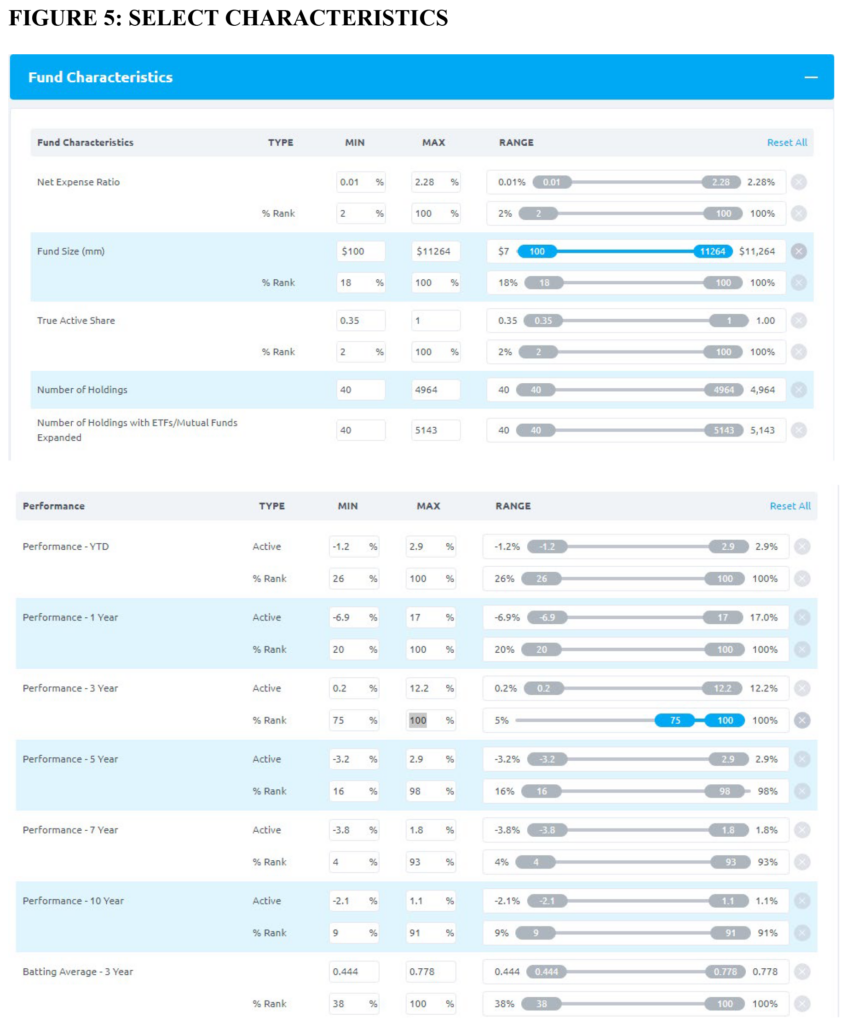
JG: In 2013, we developed the calculation of predicted active return correlation, which we like to call “PARC” for short. PARC forecasts correlations between two or more funds, and is exclusively available in Risk Lens. This can help a manager avoid investing in funds that are too similar and help ensure diversification. It also shows if substitute funds – used to replace funds for tax loss harvesting, high fees, etc. – are predicted to be highly correlated, as shown in Figure 3.
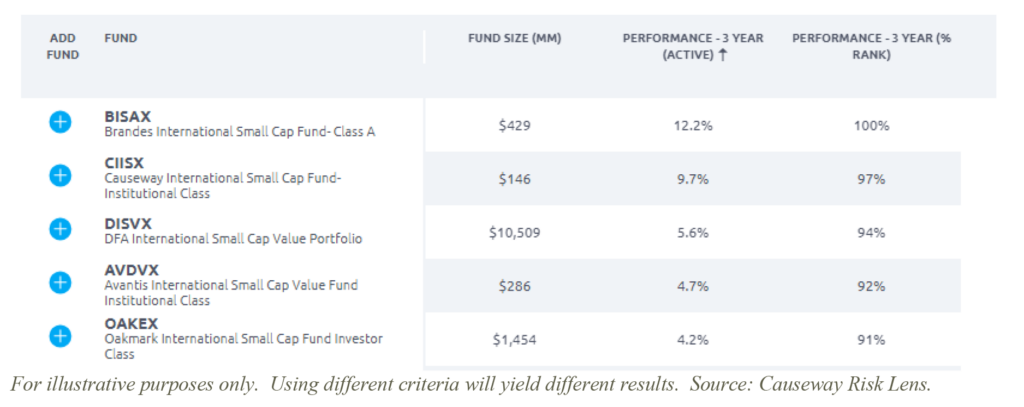
We calculate funds’ historical returns to their style, country, sector and currency exposures to forecast correlations from –1 to +1, ranging from exact opposite correlation to no correlation to exact correlation. Users can use PARC to identify top complementary and substitute funds for asset allocation, as shown in Figure 4.
We believe that our risk model and PARC formula for predicted active return correlation can help asset managers and advisers build portfolios. Risk Lens looks forward – many other tools don’t, but instead focus on historical, not forecast risk measures. They don’t show predicted active return correlations for funds. Or they’re too expensive.
Turner, your newest feature is “Fund Screener.” How does that work?
TS: We are excited about Fund Screener. The tag line is “find the funds you need – with ease.” And we think that’s what it does. Users pick a benchmark, select screens for size, fees, performance, risk, and more, then click “Find Funds.” The tool sorts through approximately 3,400 equity funds and generates the results.
As illustrated in Figure 5, Fund Screener is intuitive and easy-to-use. Let’s say you want to find the top international small cap equity performers in the prior three years with a minimum level of net assets. First select the MSCI ACWI ex USA Small Cap Index as benchmark. There are 66 funds in this universe. Set minimum fund size to $100 million (to screen out smaller funds) and input 75th percentile as the minimum rank in “Performance – 3 Year.” The universe narrows to 15 funds. Click “Find Funds” to obtain results, and sort the column labeled “Performance – 3 Year (Active)” from top-to-bottom. Below are the top 5.
Users can further refine the search as desired, adding screens for batting average, upside or downside capture, active style exposures, predicted risk metrics, and even active ESG scores.
Users can also download results into an Excel spreadsheet and incorporate the output into their own research reports or client communications.
Sarah, don’t other tools do this – what makes Risk Lens different?
SHK: Risk Lens looks forward; it focuses on the latest publicly available portfolio holdings and calculates predicted risk characteristics. So it’s “holdings based.” There are other tools out there, but many are “returns based” and therefore backward looking. These tools analyze how funds performed in the past and generate risk characteristics based on past holdings and returns. We are looking at current holdings and, from there, projecting what a fund’s risk metrics are predicted to be in the future.
Of course, there are some other sophisticated tools that can show predicted risk metrics like Risk Lens. But they tend to be much more complex to use and, frankly, expensive. Risk Lens does all this for free.
Are Causeway Funds Included?
TS: Yes, but when you use Risk Lens, you select your own funds for analysis. You can include Causeway Funds, or leave them out. And we don’t tweak Risk Lens programming to promote Causeway Funds. Risk Lens is a search engine that pulls up funds and ETFs based on the criteria entered by the user. Risk Lens has a very broad universe – it covers approximately 3,400 U.S.-registered equity mutual funds and ETFs, approximately 9,500 share classes, and 37 benchmarks across all major geographies.
Sarah, what are Causeway Fiduciary ESG Scores?
SHK: Causeway Fiduciary ESG Scores are exclusively available in Risk Lens. We assess a company on environmental, social, and governance (E, S, and G) factors we believe are financially material for the company, considering its country and sector. Our research shows that firms with top quintile Causeway Fiduciary ESG Scores outperformed firms with bottom quintile scores and the global market over time. We call our scores “fiduciary” because they focus on material ESG characteristics and their potential to affect investment performance.
JG: How do we do it? Causeway’s quantitative model assesses a company’s performance on financially material ESG factors considering its country and company characteristics. Notice our emphasis on “materiality.” We’ve found that ESG performance on issues that are actually material to a company’s business also affect its investment performance.
To calculate an overall ESG score, we assign E, S, and G weights for a company. Currently, G is the highest weight and stays the same across sectors because we believe G applies equally to all companies. E is the next highest weight followed by S, and these weights are assigned based on their materiality in the company’s sector. A company’s overall score is the weighted average of its E, S, and G scores, and we aggregate the scores of companies in a fund to calculate the fund’s overall ESG scores. To perform all these calculations, our model uses a wide variety of data from government and non-government sources.
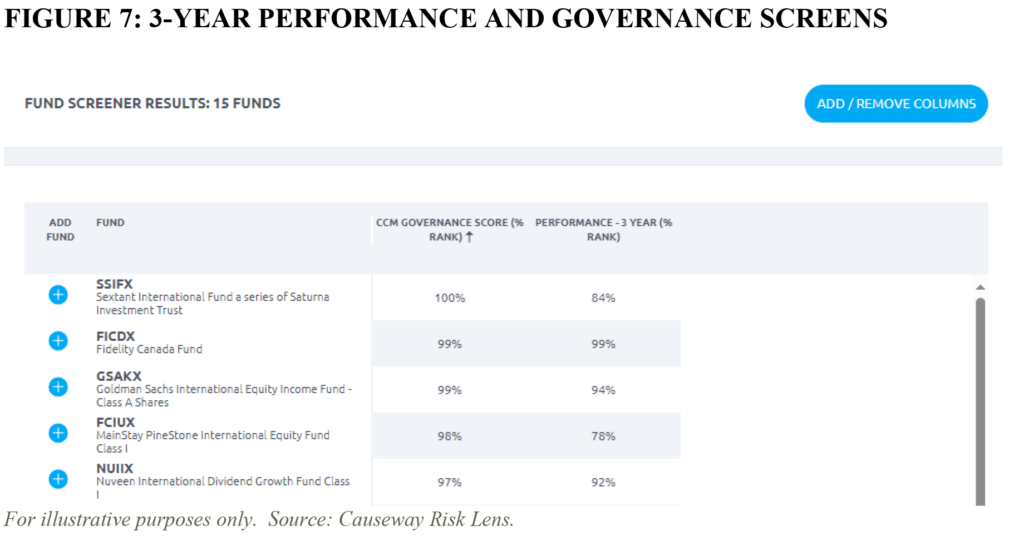
TS: And there are lots of ways to apply ESG. Take the MSCI EAFE benchmark in Risk Lens. That’s 336 funds and ETFs. Assume a user wants high trailing 3-year EAFE performers which also have high Governance or “G” scores. Using Fund Screener, you can set the 3-year performance and G screens at 75th percentile minimums. That narrows the universe to 15 funds. You can rank them highest-to-lowest by G and Figure 7 shows you the top 5 resulting funds.
Joe, can you tell us more about the risk model?
JG: In our model, we start by identifying systematic sources of risk. The Capital Asset Pricing Model (CAPM) assumes that a portion of a stock’s expected return is due to its systematic relationship or “covariance” with the market’s return (the stock’s “beta”). Since CAPM was developed, research has uncovered additional systematic factors that influence expected returns beyond the market’s movements, and multi-factor risk models are better equipped to account for these many sources of risk. Factor models will differ in the choice of factors included as well as how loadings and returns are calculated. But at their core, all multi-factor risk models involve analyzing factor returns, a portfolio’s factor loadings (or risk exposures), and the returns attributable to these loadings.
Causeway’s proprietary risk model is multi-factor and includes categories for world equity, country, currency, sector, and style in addition to assessing idiosyncratic risks not captured by the common factor categories. All stocks are impacted by the broad ebbs and flows of the overall market. Portfolio returns are also influenced by their unique geographic exposures (both country and currency exposures). Sector membership also adds to variation in returns. Finally, there are style exposures. Size, value, growth, and cyclicality are just a few style attributes of stocks which influence returns. Our risk model derives expected stock returns from the sum of the products of all factor premia (the additional return investors gain by exposure to a particular risk factor) and factor exposures. As we discussed, we transported this capability to Risk Lens, basically to provide many of the elements of our risk model directly to clients, asset managers, and advisers.
Why is Risk Lens free?
TS: We currently provide Risk Lens at zero cost. We think it’s a critical tool for our clients and advisers who use Causeway Funds, and we give it away because we believe investors make better decisions with better information. We are confident that Causeway Funds will compare well using Risk Lens or any other forward-looking analysis. We also believe Risk Lens provides Causeway significant value as a client service and business development tool.
To open a Risk Lens account, go to https://analytics.causewaycap.com/ to request a login or email us at [email protected].
Important Disclosures
About Risk Lens: Causeway manages global equities, fusing fundamental and quantitative analysis since 2001 and manages $45.5 billion (at 12/31/23). In 2013, Causeway launched Risk Lens to bring the power of its risk model to clients, introducing the easy-to-use web application in 2019. Risk Lens covers approximately 3,400 U.S.-registered equity mutual funds and ETFs, approximately 9,500 share classes, and 37 benchmarks across all major geographies.
Risk Lens is For Investment Professional Use Only – Not For Retail Distribution. See “Disclosures” in your Risk Lens reports.
IMPORTANT: The projections or other information generated by Causeway’s Risk Lens investment analysis tool regarding the likelihood of various investment outcomes are hypothetical in nature, do not reflect actual investment results, and are not guarantees of future results. The information provided by Risk Lens is for illustration only, should not be relied on as investment advice, and is not a recommendation to buy or sell any fund or security. Results may vary with each use and over time.
This commentary expresses Causeway’s views as of March 2024 and should not be relied on as research or investment advice regarding any stock. These views and any portfolio holdings and characteristics are subject to change.
To determine if a Causeway Fund is an appropriate investment for you, carefully consider the Fund’s investment objectives, risk factors, charges and expenses before investing. This and other information can be found in the downloadable full or summary fund prospectus, which may also be requested in print by calling 1-866-947-7000. Please read the full or summary prospectus carefully before you invest or send money.
The user statement provided has been edited for spelling and clarity, may not be representative of the experience of other Risk Lens users, and is no guarantee of future performance or success. The information provided is for illustration only, should not be relied on as investment advice, and is not a recommendation to buy or sell any fund or security. Results may vary with each use and over time. Causeway solicited users for statements but did not pay compensation. Statements are not from direct clients or investors, but certain statements are from employees of firms which firms are or were clients or investors or which firms advise customers who are or were clients or investors.
Mutual fund investing involves risk, including possible loss of principal. In addition to the normal risks associated with equity investing, international investing may involve risk of capital loss from unfavorable fluctuations in currency values, from differences in generally accepted accounting principles or from social, economic or political instability in other nations. Emerging markets involve heightened risks related to the same factors as well as increased volatility and lower trading volume. Current and future holdings are subject to risk. There is no guarantee that any securities mentioned will remain in or out of a Fund. Investments in smaller companies involve additional risks and typically exhibit higher volatility. Diversification does not prevent all investment losses.
Causeway Capital Management LLC serves as investment adviser for the Causeway Funds. The Funds are distributed by SEI Investments Distribution Co. (1 Freedom Valley Drive, Oaks, PA, 19456), which is not affiliated with the Causeway Funds or the investment adviser. Check the background of SEI Investments Distribution Co. on FINRA’s BrokerCheck. Please note that (i) any discussion of U.S. tax matters contained in this communication cannot be used by you for the purpose of avoiding tax penalties; (ii) this communication was written to support the promotion or marketing of the matters addressed herein; and (iii) you should seek advice based on your particular circumstances from an independent tax adviser.
There is no guarantee that the Causeway Funds will meet their stated objectives. The Causeway Funds are available to US investors only.
The MSCI EAFE Index is a free float-adjusted market capitalization weighted index, designed to measure developed market equity performance excluding the US and Canada, consisting of 21 stock markets in Europe, Australasia, and the Far East. The Index is gross of withholding taxes, assumes reinvestment of dividends and capital gains, and assumes no management, custody, transaction, or other expenses. It is not possible to invest directly in an index. The MSCI ACWI ex USA Small Cap Index captures small cap representation across 22 of 23 developed markets (excluding the US) and 24 emerging markets. With 4,419 constituents, the index covers approximately 14% of the global equity opportunity set outside the US.
MSCI has not approved, reviewed, or produced this report, makes no express or implied warranties or representations and is not liable whatsoever for any data in the report. You may not redistribute the MSCI data or use it as a basis for other indices or investment products.
Certain Risk Lens software is subject to © 2024 Causeway Capital Management LLC. All Rights Reserved.
