Contact Us
Subscribe to Causeway Insights, delivered to your inbox.
Risk Lens – our free, cloud-based investment analysis tool – helps advisers and asset managers unlock portfolio risk and manager skill. In this Q&A, Causeway portfolio manager Joe Gubler joins Turner Swan, chief operating officer of Risk Lens, to discuss why our Risk Donut is good for you.
Turner Swan: Joe, let’s start at the beginning with the obvious question. What is the Risk Donut?
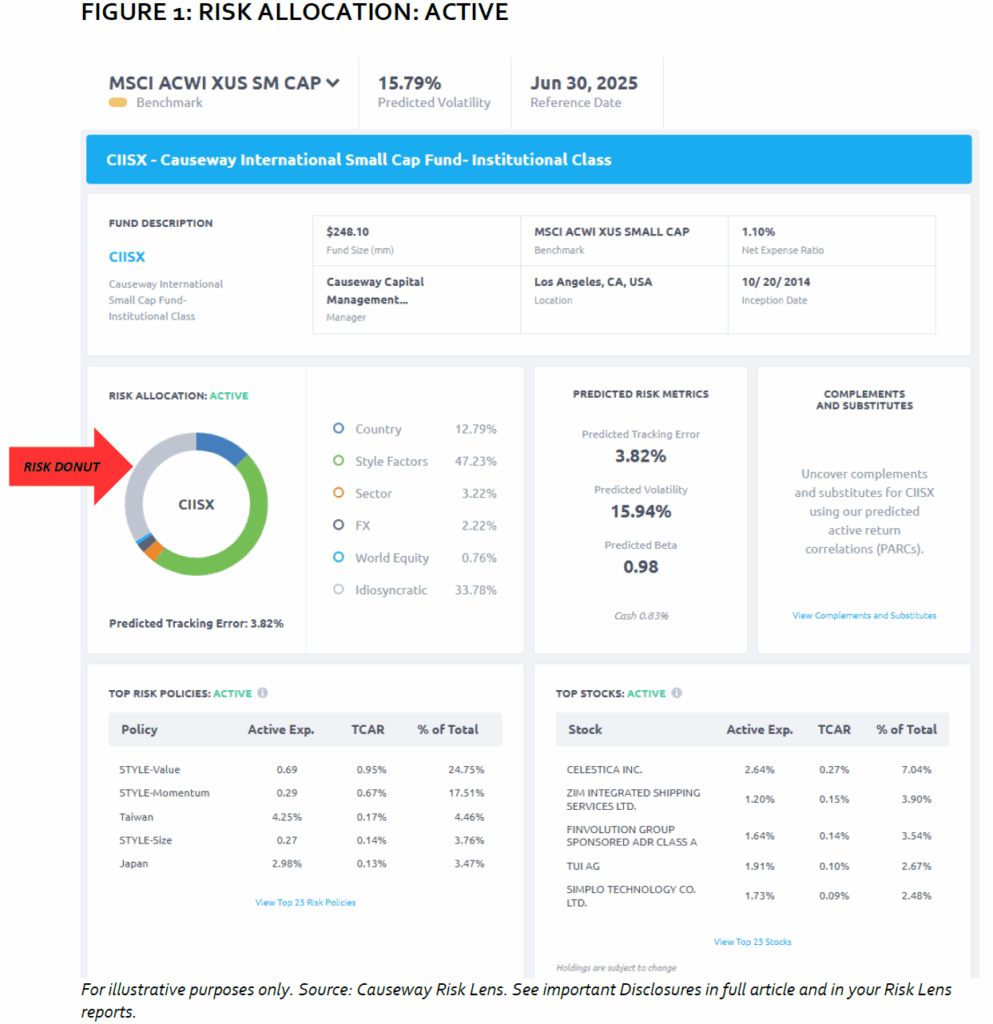
Joe Gubler: The best way to answer that is with a picture. Figure 1 below is a Single Fund Summary from Risk Lens. The circular graph labelled “Risk Allocation: Active” is what we call the Risk Donut because, well, it looks like a donut.
For a fund or ETF selected by the user, the Risk Donut shows risk allocation by category.
TS: I’ll give you that, it does look like a donut. But donuts are usually unhealthy. Why do you claim the Risk Donut is “good for you?”
JG: This is a healthy donut for investment advisers because it graphs the percentages of a fund’s six risk categories. This way, an adviser can quickly see the main risks that are contributing to predicted tracking error. For a Risk Allocation: Active report, like this one, the fund’s Active risk is defined as its Predicted Tracking Error. We then show the percentage each risk category contributes to Predicted Tracking Error.
For example, in Figure 1, Predicted Tracking Error is 3.82% and Style Factors contribute 47.23%. That means Style exposures contribute just over 1.80 percentage points of the Predicted Tracking Error (47.23% X 3.82% = 1.80%). The six risk categories will always sum to 100%.
So a user can readily see from the Risk Donut that the largest source of active risk for this fund is exposure to Style Factors. And we don’t look backwards at prior performance and prior risk exposures. The Risk Lens proprietary risk model, which is “holdings based,” forecasts risk exposures based on a fund’s latest publicly available holdings.
TS: Risk donuts are “good for you” then because they educate advisers on a fund’s key risk exposures?
JG: Exactly. It’s like a microscope into the risk posture of a fund based on its holdings.
TS: Under the Risk Donut, we have Top Risk Policies: Active. Can you describe that table?
JG: Sure. Let’s take the Taiwan exposure as an example. The 4.25% “Active Exp.” means Taiwan’s weight in the fund exceeds the benchmark weight by 4.25 percentage points. These top risks are listed by “TCAR,” which stands for total contribution to active risk, with active risk defined as Predicted Tracking Error, which you remember from Figure 1 is 3.82%. The Taiwan TCAR is 0.17 percentage points of the 3.82% tracking error or 4.46% of the total tracking error. If we wrote out the calculation it would look like this: 0.17 ÷3.82 = 4.45 (or actually 4.46 after decimal point rounding).
“Top Stocks: Active” works the same way, but instead of risk exposures, we look at each stock and rank it by TCAR. Again, TCAR is percentage points of predicted tracking error and “% of Total” is the particular stock’s percentage of total tracking error.
TS: Users sometimes ask about the “World Equity” risk category. Can you help us with that metric?
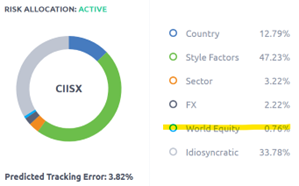 JG: The World Equity factor measures the exposure of a fund to global equity markets. Every stock is assigned an exposure of 1.0 to the World Equity factor. Cash and any other non-equity asset are each assigned an exposure of 0.0. Funds that aren’t fully invested – like funds with high cash weights – will have lower absolute World Equity percentages. And their active (benchmark relative) World Equity percentages will actually be negative. For example, if you’re looking at an Active Risk Donut, a positive World Equity percentage would mean the fund is not fully invested in equities and has market timing risk that’s increasing predicted tracking error.
TS: Here’s another question we’ve had from users. Why aren’t the active exposures of style risks expressed as percentages?
JG: That is a good question because the answer isn’t intuitive. Style active exposures are not expressed as percentages, but instead are “z-scores” from -3.0 (least representative of style) to +3.0 (most representative of style). Basically, these are standard deviation measurements. For example, a Growth style z-score of +1.0 would indicate a value that is positive one standard deviation from the mean.
TS: Right, so in that example we would expect that 68% of funds mapping to the same benchmark would have active Growth exposure within 1 standard deviation of the average or, that is, within a z-score range from -1 to +1.
JG: Yes. And then our risk model converts the style z-score into TCAR.
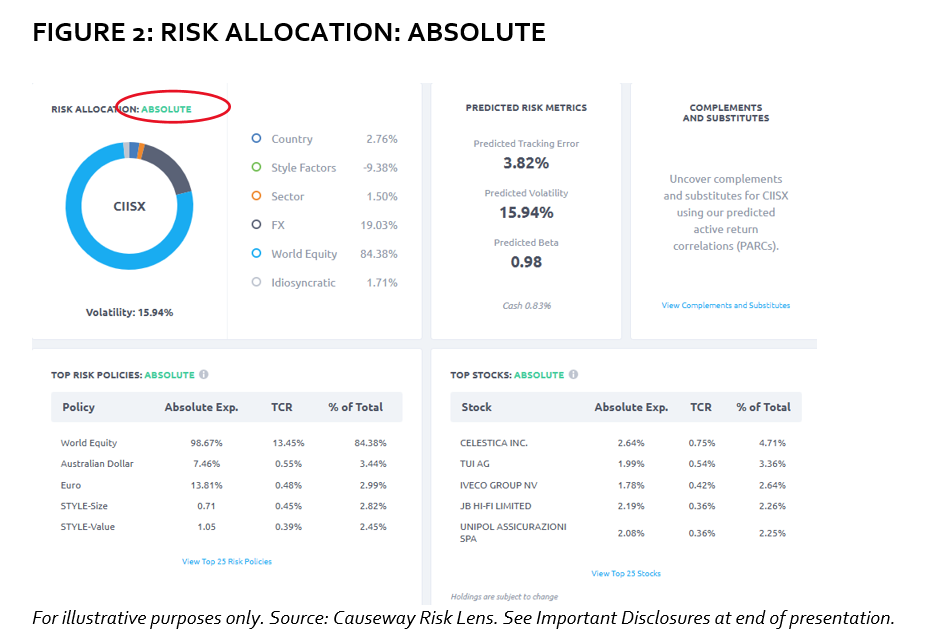
TS: We’ve been looking at active risk, which is relative to the benchmark. What if a user wants to look at absolute risk?
JG: Then you would select the “Absolute On” button like this:

The Risk Donut in Figure 2 shows absolute exposures to the six risk categories, and the same for Top Risk Policies and Top Stocks. The absolute exposures are listed by “TCR” or total contribution to risk, with risk defined as predicted volatility. The volatility percentage represents one standard deviation from the fund’s mean return. The “TCR” values are percentage points, and the total TCRs of all risk exposures (or all stock exposures) will equal the volatility percentage.
TS: So when you’re running an “absolute” Risk Donut report, like in Figure 2, it’s important to remember that the risk contributions are portions of predicted volatility, rather than predicted tracking error.
“Risk Donut” showing absolute risk allocation by category.
FIGURE 2: RISK ALLOCATION: ABSOLUTE
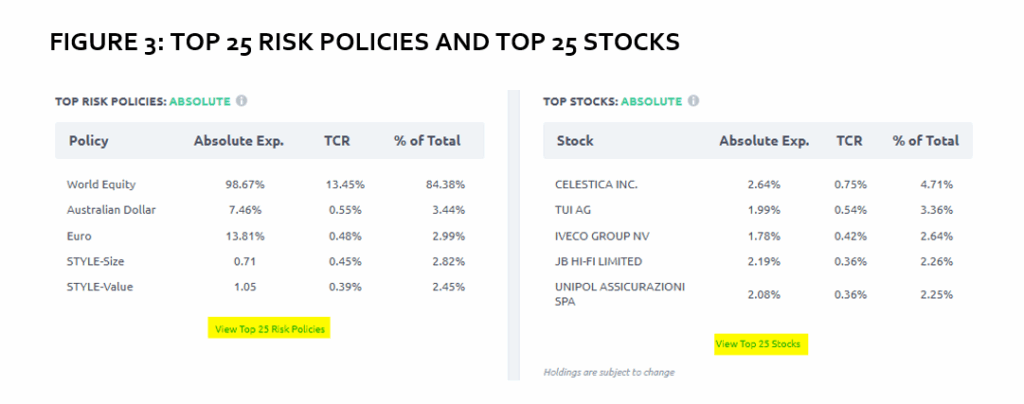
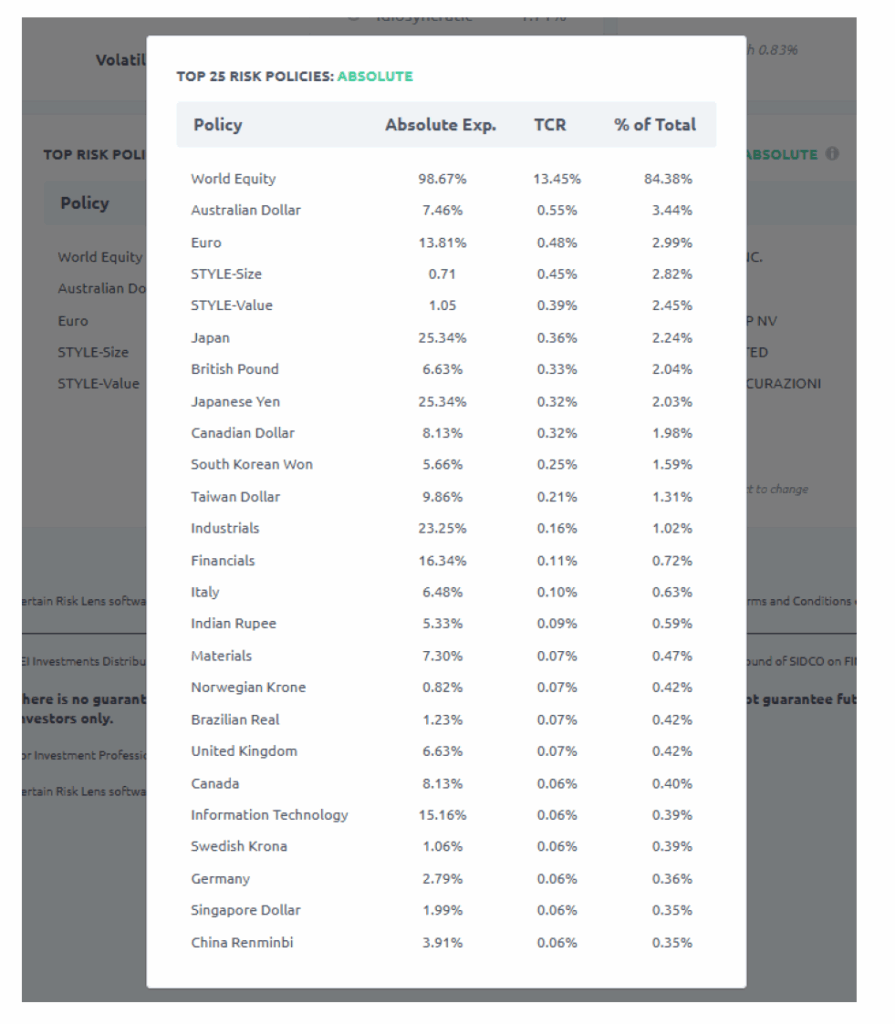
JG: Yep. There is one other cool feature I wanted to mention. The screen only shows top 5 risk policies and stocks – whether by TCAR for active or TCR for absolute – but users can click on “View Top 25 Risk Policies” or “View Top 25 Stocks” to drill down to see top 25 risk exposures or stocks. Using this enhanced “X-Ray” feature, you can look even further into a portfolio.
Click these links to drill down to top 25 risk exposures and stocks.
TS: Joe, thank you for explaining our Risk Donut and some of Risk Lens’ other key risk features.
To sign up for Risk Lens, go to analytics.causewaycap.com.
Important Disclosures
About Risk Lens: Causeway manages global equities, fusing fundamental and quantitative analysis since 2001 and manages $61.7 billion (at 6/30/25). In 2013, Causeway launched Risk Lens to bring the power of its risk model to clients, introducing the easy-to-use web application in 2019. Risk Lens covers approximately 3,700 U.S.-registered equity mutual funds and ETFs, approximately 9,500 share classes, and 37 benchmarks across all major geographies.
Risk Lens is For Investment Professional Use Only – Not For Retail Distribution. See “Disclosures” in your Risk Lens reports.
IMPORTANT: The projections or other information generated by Causeway’s Risk Lens investment analysis tool regarding the likelihood of various investment outcomes are hypothetical in nature, do not reflect actual investment results, and are not guarantees of future results. The information provided by Risk Lens is for illustration only, should not be relied on as investment advice, and is not a recommendation to buy or sell any fund or security. Results may vary with each use and over time.
This commentary expresses Causeway’s views as of August 2025 and should not be relied on as research or investment advice regarding any stock. These views and any portfolio holdings and characteristics are subject to change.
To determine if a Causeway Fund is an appropriate investment for you, carefully consider the Fund’s investment objectives, risk factors, charges and expenses before investing. This and other information can be found in the downloadable full or summary fund prospectus, which may also be requested in print by calling 1-866-947-7000. Please read the full or summary prospectus carefully before you invest or send money.
Mutual fund investing involves risk, including possible loss of principal. In addition to the normal risks associated with equity investing, international investing may involve risk of capital loss from unfavorable fluctuations in currency values, from differences in generally accepted accounting principles or from social, economic or political instability in other nations. Emerging markets involve heightened risks related to the same factors as well as increased volatility and lower trading volume. Current and future holdings are subject to risk. There is no guarantee that any securities mentioned will remain in or out of a Fund. Investments in smaller companies involve additional risks and typically exhibit higher volatility. Diversification does not prevent all investment losses.
Causeway Capital Management LLC serves as investment adviser for the Causeway Funds. The Funds are distributed by SEI Investments Distribution Co. (1 Freedom Valley Drive, Oaks, PA 19456), which is not affiliated with the Causeway Funds or the investment adviser. Check the background of SEI Investments Distribution Co. on FINRA’s BrokerCheck.
There is no guarantee that the Causeway Funds will meet their stated objectives. The Causeway Funds are available to US investors only.
The MSCI ACWI ex USA Small Cap Index, is a free float-adjusted market capitalization weighted index, designed to measure the equity market performance of developed and emerging markets excluding the U.S. market. The Index covers approximately 14% of the free float adjusted market capitalization in each country. The Index is gross of withholding taxes, assumes reinvestment of dividends and capital gains, and assumes no management, custody, transaction or other expenses. It is not possible to invest directly in an index.
MSCI has not approved, reviewed, or produced this report, makes no express or implied warranties or representations and is not liable whatsoever for any data in the report. You may not redistribute the MSCI data or use it as a basis for other indices or investment products.
Certain Risk Lens software is subject to © 2025 Causeway Capital Management LLC. All Rights Reserved.