Contact Us
Subscribe to Causeway Insights, delivered to your inbox.
Allocating across emerging and developed markets is inherently complex. Investors must navigate differences in risk and return profiles and deep structural and macroeconomic divergences that evolve over time. Without a disciplined, data-driven process, these variables are easy to overlook, and difficult to time.
Since 2007, Causeway has employed a proprietary, data-driven allocation model within our International Opportunities strategy to assess the relative attractiveness of Emerging Markets (EM) and Developed Markets (DM). This disciplined, quantitative approach is designed to complement the strategy’s stock selection by integrating signals spanning valuation, business quality, earnings trends, macroeconomic conditions, and investor sentiment.
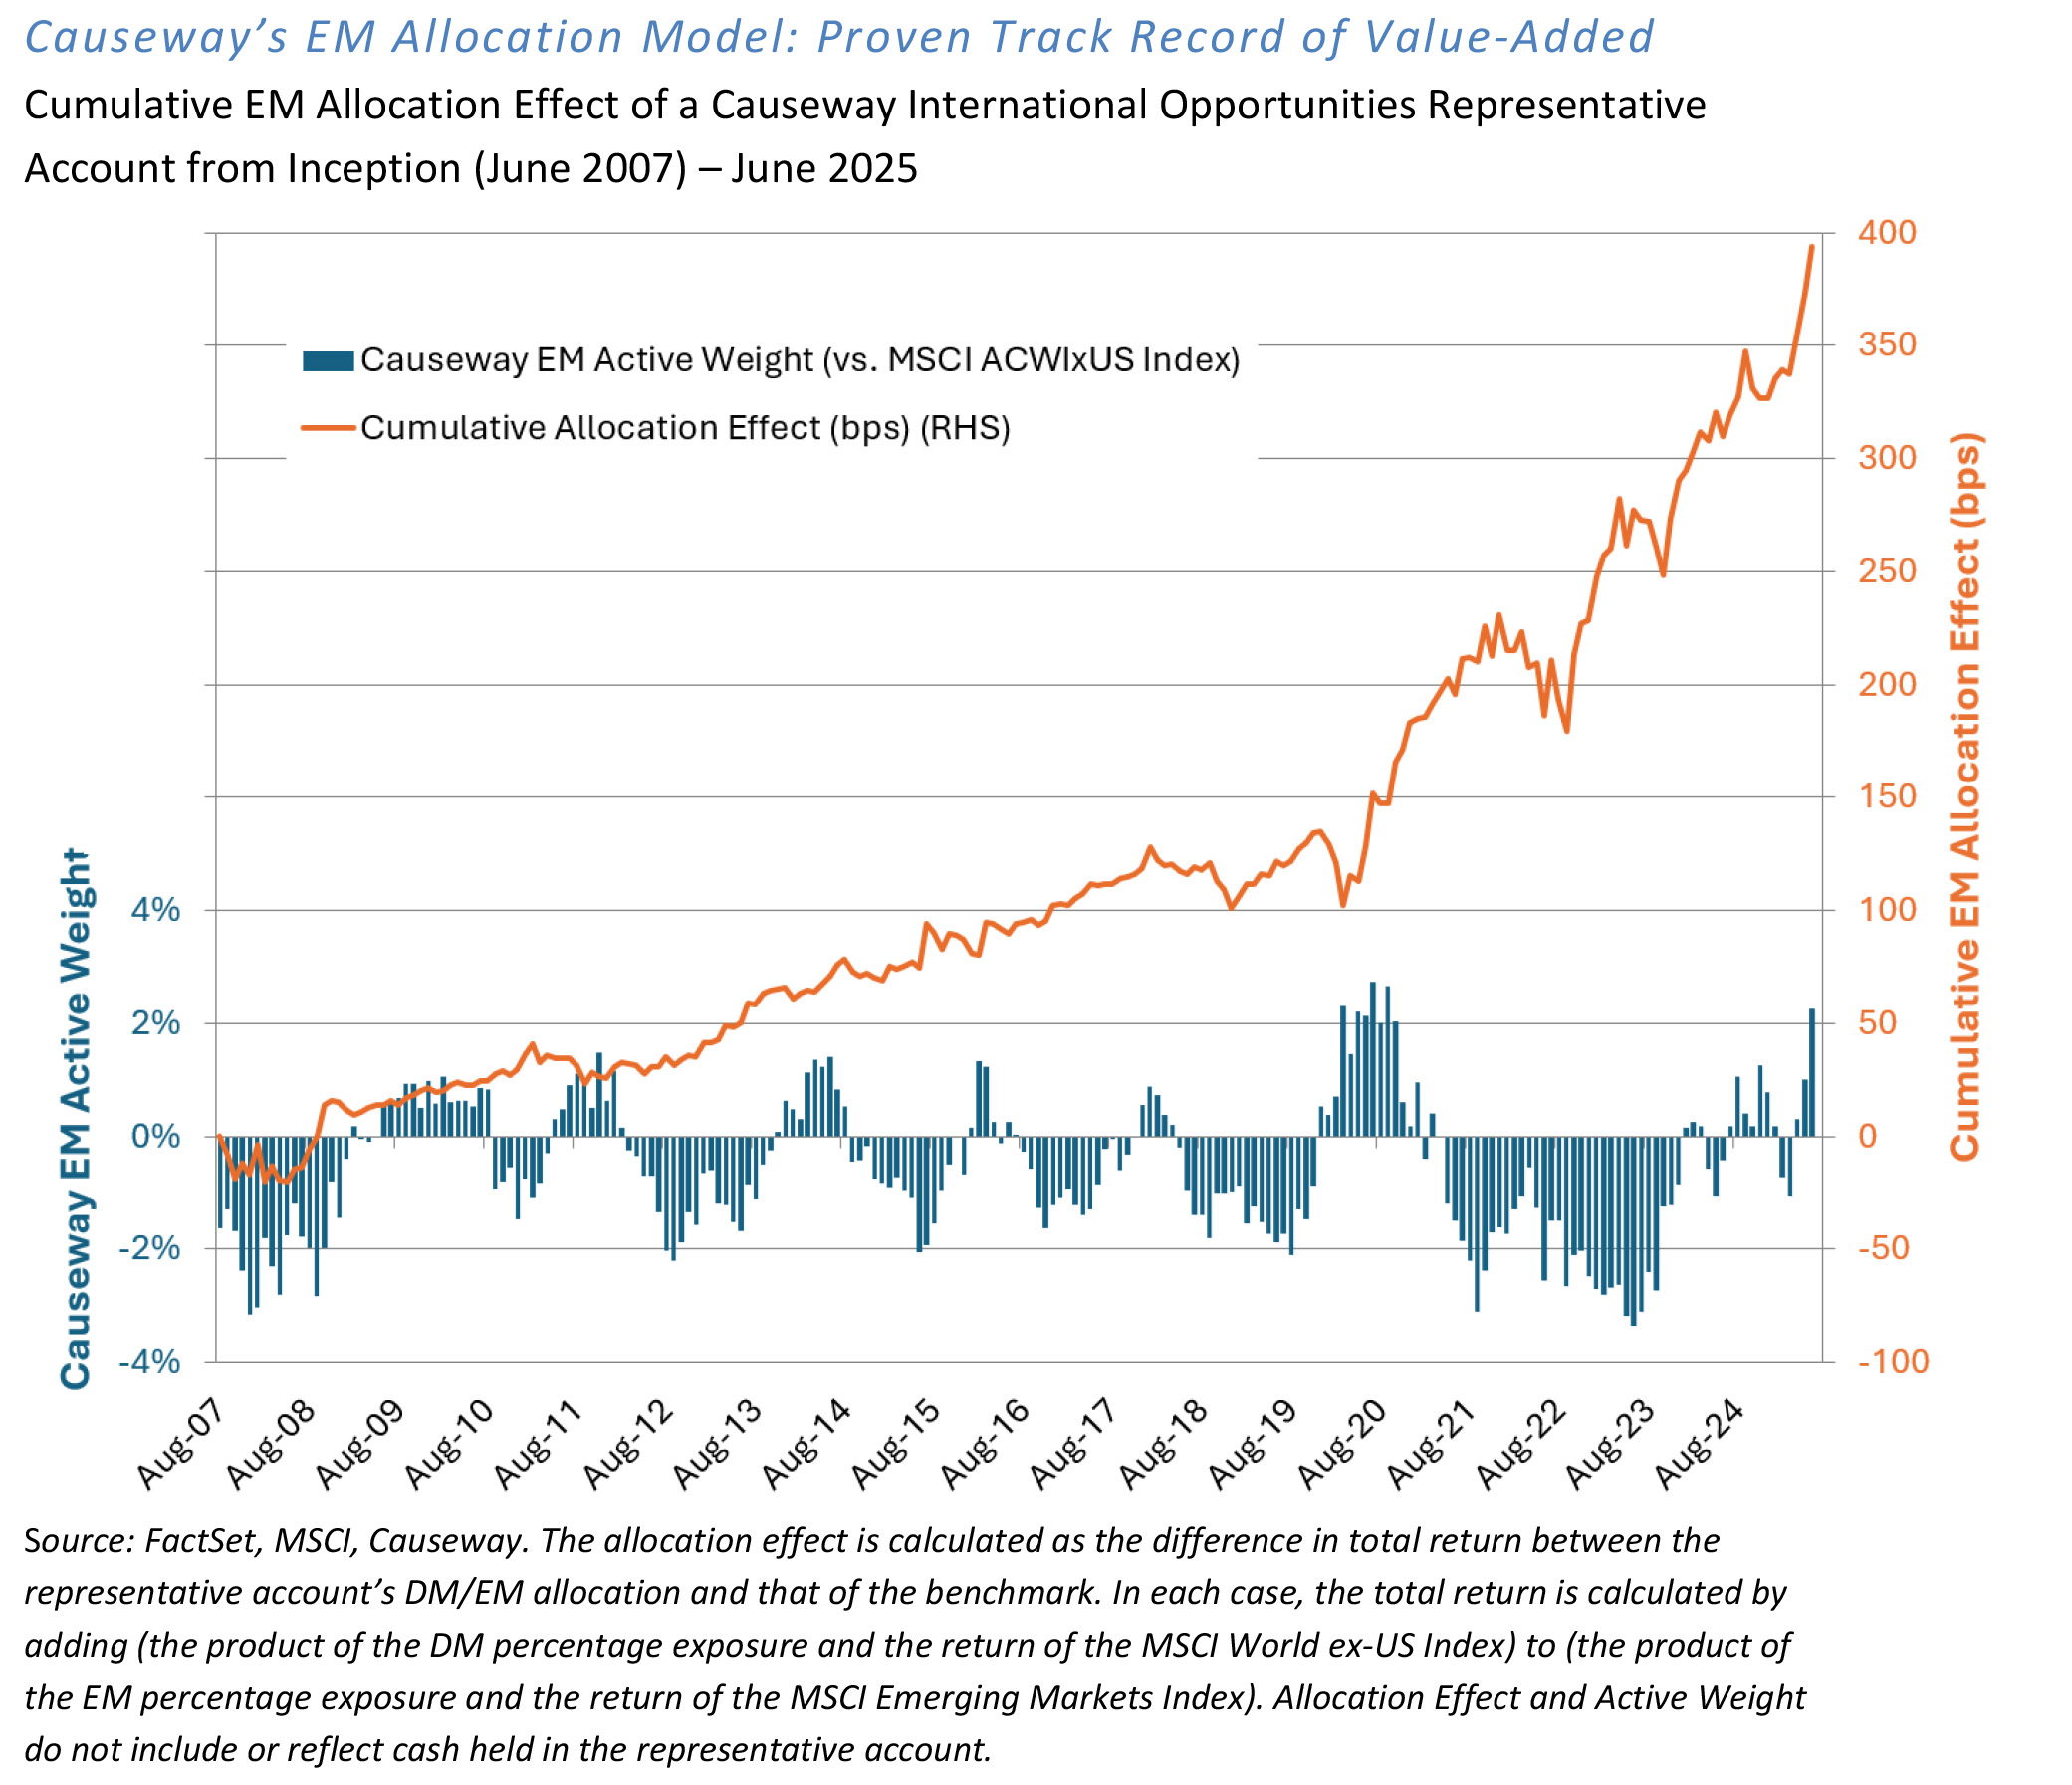
We designed our allocation model to be scalable, so its active weight recommendations can better align with investors’ preferred magnitudes of active EM exposure. For the International Opportunities strategy, we have kept our dynamic EM exposure within a relatively narrow band, ±4% of the EM weight in the MSCI ACWI ex USA Index. Even within this modest range, the EM allocation alone has contributed a cumulative 3.9% to gross alpha for the strategy, since its inception on June 30, 2007. An information ratio of 1.3 underscores the model’s ability to generate meaningful excess returns while maintaining disciplined benchmark-relative risk.
Why we use a dynamic allocation model for Emerging Markets
- Relative value shifts: Valuation remains a key driver of long-term returns, even in growth-oriented markets. EM has historically traded at a discount to DM, but that gap has fluctuated with sentiment, macroeconomic conditions, politics, and structural shifts. As EM transitions toward higher-value sectors, our valuation approach incorporates multiple historical time frames—5-, 10-, and 20-year—to account for structural change.
- Evolving corporate fundamentals: Improvements in corporate governance, profitability, and capital discipline across many EM markets are reshaping the asset class. Our quality analysis tracks these shifts using 5-, 10-, and 20-year relative comparisons, which is designed to capture both cyclicality and long-term evolution in EM fundamentals.
- Earnings-driven capital flows: Near-term earnings momentum and analyst sentiment can materially influence EM asset flows. Our earnings growth factor category aims to integrate these signals. We are generally willing to pay a higher multiple for an EM company with positive sentiment and earnings catalysts.
- Overall superior long-term growth potential: EM often offers stronger long-term growth, led by shifts toward innovation-led development in countries like China, India, and Brazil. Others remain commodity- and manufacturing-driven, which we monitor through indicators like the OECD Composite Leading Indicators (CLI). EM performance is typically more sensitive to currency and liquidity trends—strengthening currencies, falling rates, and a weaker USD—factors we incorporate into our macroeconomic analysis.
- Higher risk sensitivity: EM volatility tends to exceed DM and emerging markets often are the first to react when global sentiment shifts. We deploy a contrarian risk aversion approach, favoring EM when investor risk aversion is high. We are cautious when markets become complacent, as EM is typically most exposed to sudden disruptions.
Model Framework: Five Key Factor Categories
|
Factor Category |
Representative Metrics |
|
Valuation |
Book-to-price, earnings-to-price |
|
Quality |
Return on equity, profit margins, historical growth consistency |
|
Earnings Growth |
Up/down earnings revision ratios (float- and equal-weighted) |
|
Macroeconomic |
Interest rates, USD movement, gross domestic product growth, OECD CLI |
|
Risk Aversion |
VIX, VXEEM, EM sovereign spreads, high yield spreads |
A Proven, Evolving Advantage
Financial markets are not static—and neither is our EM-DM allocation model. As capital flows, monetary regimes, and global economic structures evolve, so too must our approach. Over time, we’ve refined our inputs to better reflect the realities of today’s investment landscape. For example, we updated our macroeconomic signal to emphasize global liquidity over yield curve shape in a low-growth environment; added high yield bond spreads over US Treasuries to reflect how the Fed responds to changes in financial conditions; and incorporated OECD CLI with the differing drivers of EM and DM growth. These enhancements help the model deliver timely and relevant insights, which we believe leads to more consistent alpha delivery.
By translating top-down signals into actionable allocation decisions, Causeway’s proprietary allocation model helps clients, in our view, capture opportunity, manage risk, and adapt to changing global markets. For investors seeking to enhance their global equity exposure, we believe this integrated framework offers a distinct advantage—grounded in evidence, responsive to market shifts, transparent and repeatable.
This market commentary expresses Causeway’s views as of July 2025 and should not be relied on as research or investment advice regarding any stock. These views and any portfolio holdings and characteristics are subject to change. There is no guarantee that any forecasts made will come to pass. Forecasts are subject to numerous assumptions, risks, and uncertainties, which change over time, and Causeway undertakes no duty to update any such forecasts. Information and data presented has been developed internally and/or obtained from sources believed to be reliable; however, Causeway does not guarantee the accuracy, adequacy, or completeness of such information.
The views herein represent an assessment of companies at a specific time and are subject to change. There is no guarantee that any forecast made will come to pass. This information should not be relied on as investment advice and is not a recommendation to buy or sell any security. For full performance information regarding Causeway’s strategies, please see www.causewaycap.com.
The Cboe Volatility Index (VIX) is a calculation designed to produce a measure of constant, 30-day expected volatility of the U.S. stock market, derived from real-time, mid-quote prices of S&P 500® Index (SPX℠) call and put options. The Cboe Emerging Markets Volatility Index (VXEEM) is a VIX-style estimate of the expected 30-day volatility of returns on EEM, an iShares MSCI Emerging Markets ETF that seeks to track the investment results of an index composed of large- and mid-capitalization emerging market equities. Like VIX, VXEEM is calculated by interpolating between two weighted sums of option mid-quote values, in this case options on EEM.
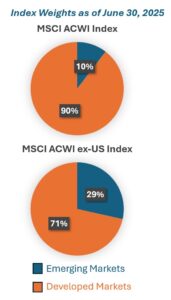
The MSCI ACWI ex-US Index captures large and mid-cap representation across 23 developed markets and 24 emerging markets countries. It is not possible to invest directly in an index.
MSCI has not approved, reviewed, or produced this report, makes no express or implied warranties or representations and is not liable whatsoever for any data in the report. You may not redistribute the MSCI data or use it as a basis for other indices or investment products.
Key insights
- Causeway’s emerging markets allocation model is designed to generate incremental alpha through active weight recommendations.
- A disciplined, five-factor framework drives EM vs. DM positioning.
- We have refined our approach to evolving market structures, to keep the model relevant.