Contact Us
Subscribe to Causeway Insights, delivered to your inbox.
by Ryan Myers, Senior Quantitative Research Analyst
Change is one of the few constants in the world of quantitative investing. Successful quant strategies and models must continually evolve as market efficiency improves and some market anomalies are arbitraged away. Recent years have witnessed the significant growth in data volume (big data), proliferation of unconventional data types (alternative data), and application of innovative techniques to process and distill this new data such as machine learning and natural language processing. The increasing availability of much cheaper and faster computational power via cloud-based resources is accelerating these changes. And yet despite all the advances, the ground rules of quantitative investing remain the same.
Key insights
- The expanding sea of data and the adoption of new technologies such as artificial intelligence and machine learning has made human judgement more important than ever.
- We believe investment research can benefit from analysis of high-volume data sources where the signal-to-noise ratio is particularly low.
- We highlight four recent Causeway research projects that have demonstrated promise: two use big data and two analyze alternative data used for “nowcasting.”
Contrary to popular opinion, the explosion of data has made the role of human judgment more important than ever.
Contrary to popular opinion, the explosion of data has made the role of human judgment more important than ever. Most “big data” sources are largely unstructured, meaning that it takes much more effort and attention to format and “clean” the data for analysis (by removing sources of bias and outliers). New data sources and techniques also create additional data mining pitfalls. Advanced computational techniques such as machine learning can uncover patterns in historical data, particularly non-linear effects and complex interaction effects. But they are less effective at discovering the rationale for those patterns, often identifying spurious and counter-intuitive relationships. For a market anomaly to be exploited consistently in the future, there must be a dependable reason why it exists. Reliable market anomalies usually have a risk-based, behavioral-based, or structural-based explanation. And in order to ensure the robustness of factors, human judgment should govern the signal construction process. Though their track records are short, many of the dedicated artificial intelligence (AI) funds that lack this human insight have underperformed in the last few years[1].
That said, there are areas of investment research that may favor these techniques, especially when considering high-volume data sources where the signal-to-noise ratio is particularly low (such as web-scraping and textual analysis). At Causeway, we believe we have the tools, data, and expertise to harness the potential alpha of these sources. We are continuously analyzing new data and new techniques for use across our strategies. Over the last several years, we have augmented the Causeway quantitative team with talented colleagues trained in these techniques. And our fundamental colleagues provide us a unique advantage in helping validate the effectiveness of new data sources. Nevertheless, wary of the pitfalls, we maintain high standards for adding new signals to our quantitative stock selection models and for utilizing alternative data to inform fundamental investment decisions. Clients should expect to see steady and incremental enhancements to our investment processes rather than any abrupt shifts. In the discussion that follows, we highlight four recent research projects that have demonstrated promise, two of which concern big data (and the techniques to process them) and two of which deal with alternative data used for “nowcasting.”
I. Predict Election Results using Twitter
One area of our research into big data sources focuses on analyzing sentiment from social media data, specifically Twitter. It goes without saying that there is quite a lot of “noise” in tweets, but when aggregated they may also represent a timely “poll” of popular opinion. Elections, referendums, and other cases where popular opinion directly determines an outcome are therefore promising applications of Twitter analysis. Geopolitical risk is usually difficult to navigate in situations when electoral results can have significant sway over a country’s public markets. With traditional third-party polls, pollsters attempt to mitigate a myriad of potential biases before collecting opinions, but they frequently predict incorrectly (e.g., Brexit, 2016 US election). And by the time pollsters have collected a statistically significant number of opinions, their polling results may be stale. With Twitter feed analysis, we can collect tweets in real-time and then seek to weed out any potential biases after collecting the data.
India’s 2019 parliamentary election was Causeway’s first foray into predicting election results using Twitter data. At year-end 2019, India represented the fourth largest market in the MSCI Emerging Markets Index (EM Index). The Lok Sabha (lower house of parliament) has 543 elected members, so 272 seats are required for a majority. Since Prime Minister Narendra Modi’s election in May 2014, his Bharatiya Janata Party (BJP) had held a slim majority in parliament. The broader BJP-led coalition, the National Democratic Alliance (NDA), had used this majority to enact a variety of market-friendly legislation focused on infrastructure spending, tax reform, and rural reflation. The market rewarded these efforts: The Indian equity market outperformed the EM Index by over 27% from May 2014 to December 2018.
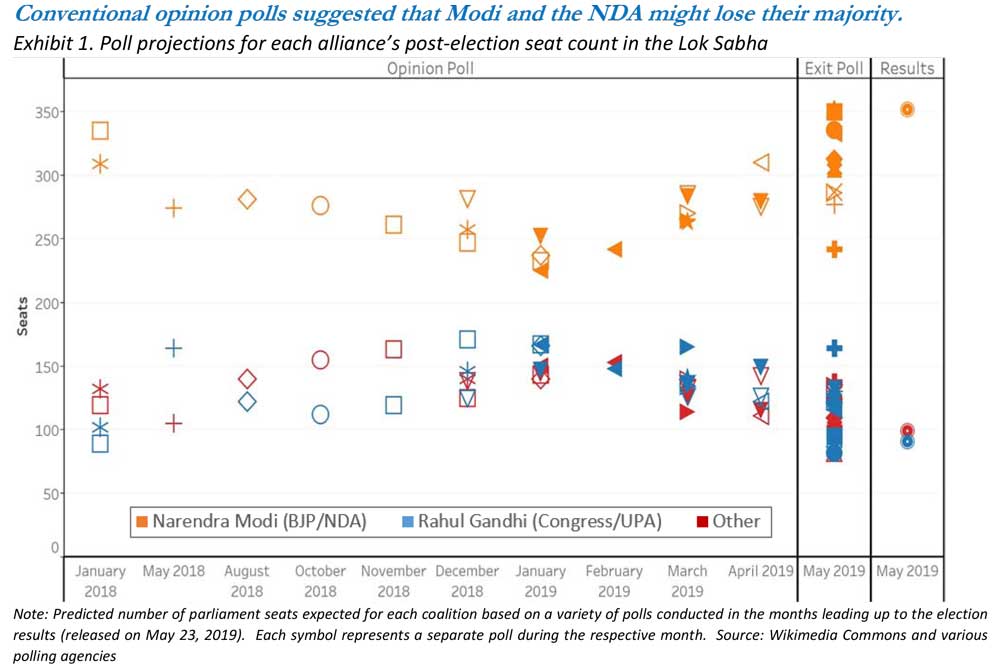
Due to the sheer size of the Indian population, the 2019 election was held over six weeks between April 11 and May 19, 2019 (with results released on May 23). As Exhibit 1 shows, the public opinion polls in the early months of 2019 predicted that Modi and the NDA would end up with somewhere between 250 and 300 seats. Rahul Gandhi’s Indian National Congress party and its broader United Progressive Alliance (UPA) were predicted to pick up some seats. These polls raised considerable doubt that the NDA would capture the required 272 seats to retain its majority. Holding aside Modi’s more recent controversies, market participants and political pundits believed at the time that if the NDA lost its majority, its reform agenda and policy continuity might be placed in jeopardy.
Our Twitter analysis proved a more effective election predictor than the conventional opinion polls.
To develop an alternative Twitter-based sentiment measure, we began by retrieving all tweets that included certain keywords related to the election and political parties. We then filtered out tweets by non-Indian users and media outlets (both non-voters), tweets from accounts only recently created (users with agendas), tweets from accounts with few followers (“zombie” users), tweets with too many hashtags (attention seekers), and tweets from users who tweet excessively (likely bots). We then hired a group of Indian nationals to go through 10,000 sample tweets and, using their local knowledge, classify them depending on which candidate/party the tweet supported. This sample was then used to “train” a machine learning model that sorted future tweets. Even after filtering, the model processed over one million tweets in March and April alone from over 320,000 users. The results of this analysis appear in Exhibit 2, which shows much more consistent and overwhelming support for Modi’s BJP/NDA than public opinion polls were suggesting.
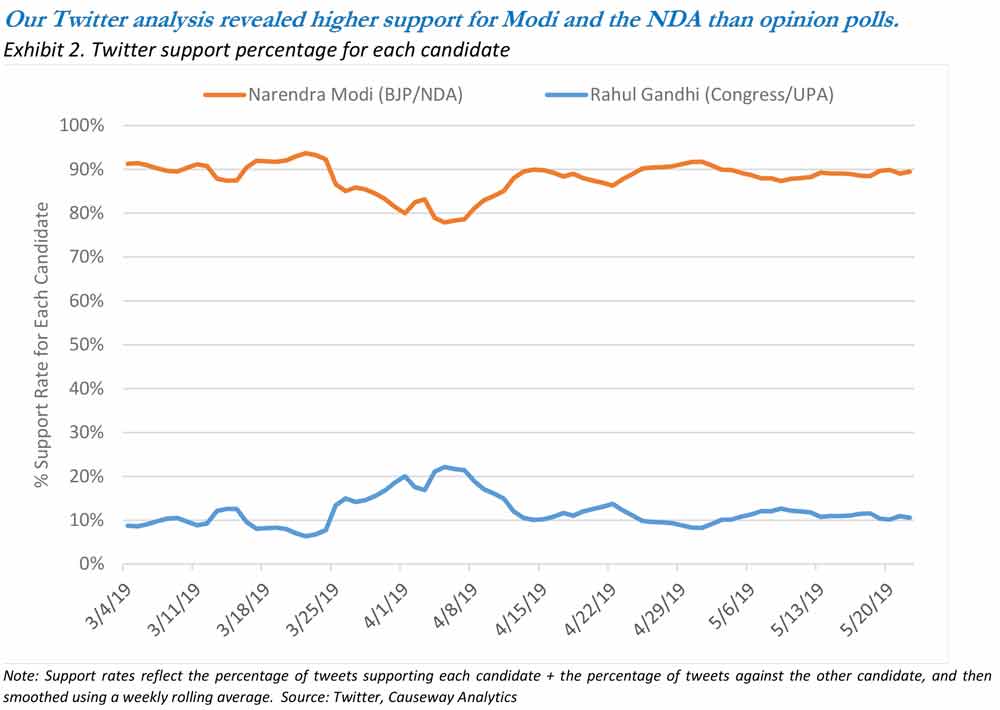
In addition to the other factors in our quantitative model, this analysis gave us confidence to remain overweight India in our Emerging Markets strategy as the election drew near. Our Twitter analysis proved a more effective election predictor than the conventional opinion polls: Once all the votes were tallied, the BJP-led National Democratic Alliance won 353 seats in a landslide victory. Since the 2019 Indian election, we have continued to monitor Twitter feeds to gauge the potential for surprises in other high-profile elections. We have also investigated ways to broaden our application of Twitter analysis to other types of political events (e.g., Brazilian pension reform) as well as sentiment around consumer products.
II. Predict Earnings Revisions by Analyzing Earnings Call Sentiment
Our research using machine learning and natural language processing to analyze earnings call transcripts has also yielded encouraging results. These public conference calls offer company management the opportunity to provide potentially more candid remarks and additional detail than formal earnings releases. Because of this, they are a complementary source of guidance for future earnings and may be predictive of subsequent revisions of earnings estimates.
“Training” machine learning software on historical data has two major advantages over a “dictionary” approach: It can better incorporate subtle linguistic differences and it can also be applied to foreign-language text.
There are various ways to “score” a transcript’s sentiment and potential earnings revisions impact. A dictionary approach assigns positive or negative values to specific words or groups of words based on how they are typically used. However, this approach tends to produce mixed results as most dictionaries fail to appreciate nuances in colloquial language. Alternatively, machine learning techniques allow the software to determine what is good and bad by “training” it on historical data. This approach has two major advantages: It can better incorporate subtle linguistic differences and it can also be applied to foreign-language text.
In our backtests of the machine learning approach, we analyzed transcripts covering US, international, and emerging markets companies since 2006. Over this period, the model was re-trained each year using the previous three years of transcripts. During each training period, the model identified language indicators associated with positive and negative analysts’ earnings-per-share (EPS) estimate changes in the 30 days following an earnings call. The backtest then took a long position in stocks predicted to have upward EPS revisions (based on positive transcript sentiment) and shorted stocks predicted to have negative EPS revisions (based on negative transcript sentiment). To prevent look-ahead bias and allow enough time for calls to be transcribed to text, we assumed that positions could only be initiated using the closing price on the day after the earnings call. Comprising over 8,500 long and short backtested positions, Exhibit 3 plots the average market-relative returns for the 60 days following each earnings call.
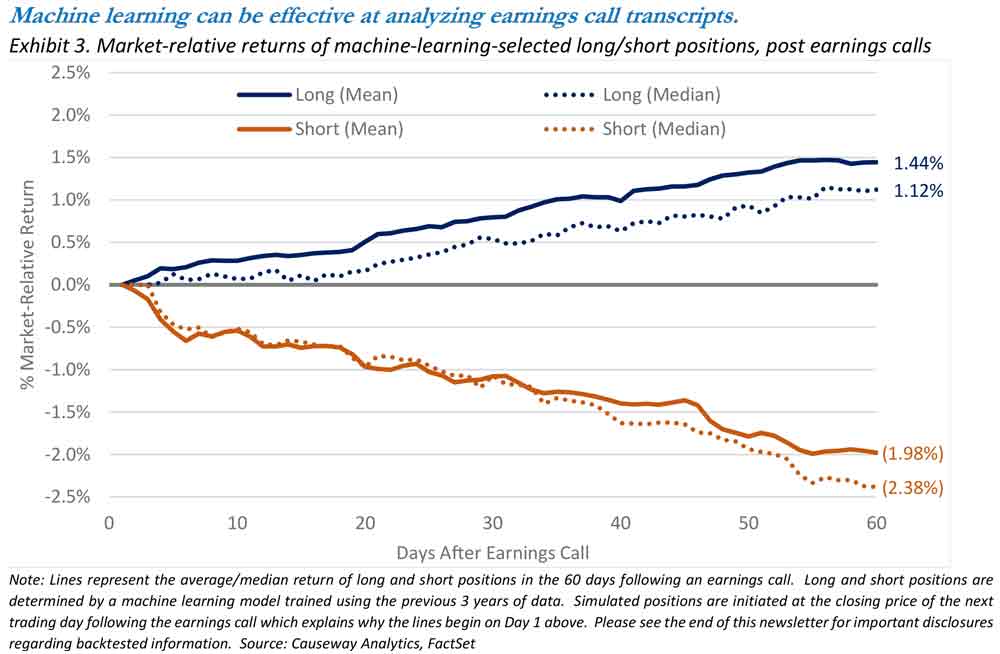
The chart above illustrates that the earnings call effect persists for the next two months following the call. Stocks with positive earnings calls outperform the market by over 1%, on average, and stocks with negative earnings calls underperform the market by around 2%. This type of data, which is predicated on a specific event (an earnings call), is difficult to incorporate in a continuous alpha model since earnings calls only occur quarterly or semi-annually. As a result, we plan to flag extreme examples to identify specific calls that the machine learning approach predicts are likely to impact the EPS revisions of stocks covered by both our fundamental and quantitative analysts. That should allow us potentially to alter the timing of trades if an earnings call has recently occurred.
III. Predict Stock Performance using Mobile App Usage Data
Some data providers offer exclusive access to real-time data that can be used to estimate concurrent financial performance, a practice also referred to as “nowcasting.”
In addition to harnessing new techniques to analyze existing sources of unstructured, “big data,” as in the previous two examples, we frequently trial novel datasets. Some data providers offer exclusive access to real-time data that can be used to estimate concurrent financial performance, a practice also referred to as “nowcasting.” One such data vendor we use provides mobile app usage data for over 1.3 billion devices in China. With the growing weight of the large Chinese information technology stocks in the EM Index (the two largest constituents together account for over 10% of the EM Index’s weight as of 12/31/2019), additional information to assess these stocks is increasingly important.
This particular data source allows us to link specific app usage to its corporate owner (and the stock), from which we can then try to extrapolate its future financial performance. Data fields available for analysis include aggregated data about an app’s penetration (what percentage of mobile devices have a particular app installed), daily average users, and the frequency and time spent on the app (users consent to the collection of information when installing the app). To test the efficacy of these metrics, at each month end we formed a long portfolio by taking the top quintile of stocks sorted by each metric’s month-over-month percentage growth and formed a short portfolio with the bottom quintile. Rebalancing the portfolios monthly, we tracked the cumulative returns for a 3-year period spanning 2016-2019. Exhibit 4 shows the results of our backtests.
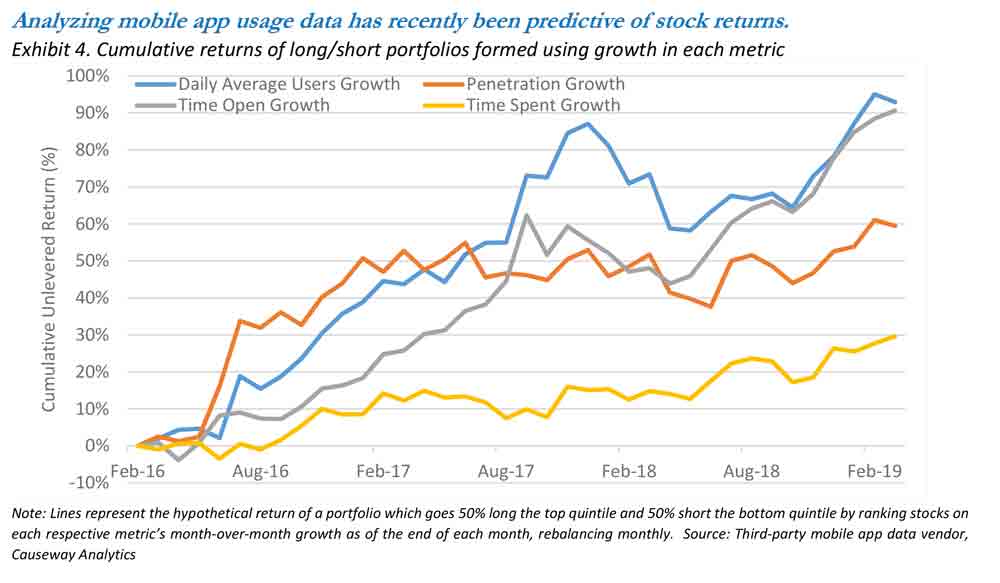
As the exhibit illustrates, this data has significant information content. The usage data provides a daily snapshot of the popularity of a company’s apps, which we believe can translate well to financial performance (more app usage = higher revenue generated through that app) and stock price returns. The three-year returns of hypothetical unlevered portfolios (50% long / 50% short) constructed on these tracked metrics range from 30% to 90%. We discussed these results at length with our fundamental IT analysts to give us greater confidence that there was a causal link. Their input was especially important here given the short data history, a common characteristic of alternative data. Fortunately, Causeway’s unique combination of fundamental and quantitative expertise allows us to further validate new data sources and, based on these promising results, Causeway added mobile app usage statistics as a growth alpha factor to our Emerging Markets strategy in 2019.
IV. Predict Stock Price Reaction using Credit Card Data for Retailers
Credit card data have provided another unique avenue for “nowcasting” research. Not so long ago, the trendy alternative data for assessing retailers consisted of satellite pictures of parking lots. With the growing dominance of online shopping, counting cars in parking lots is no longer a reliable indicator of a retailer’s financial performance. However, credit card data can now take analysts even “closer” to the transaction, yielding a near real-time pulse of sales trends. Unfortunately, most credit card data providers only have access to a small fraction of credit cards, usually from a few specific card-issuing banks. Therefore, the efficacy of this data depends on both the prevalence of credit card transactions as well as how well the sample (usually comprising only 1-2% of total sales) represents the larger sales trends for the company. We recently began using aggregated data from one such vendor. Even though the vendor covers over 400 companies/stocks, there is a significant amount of variation across stocks in how well the data predict sales.
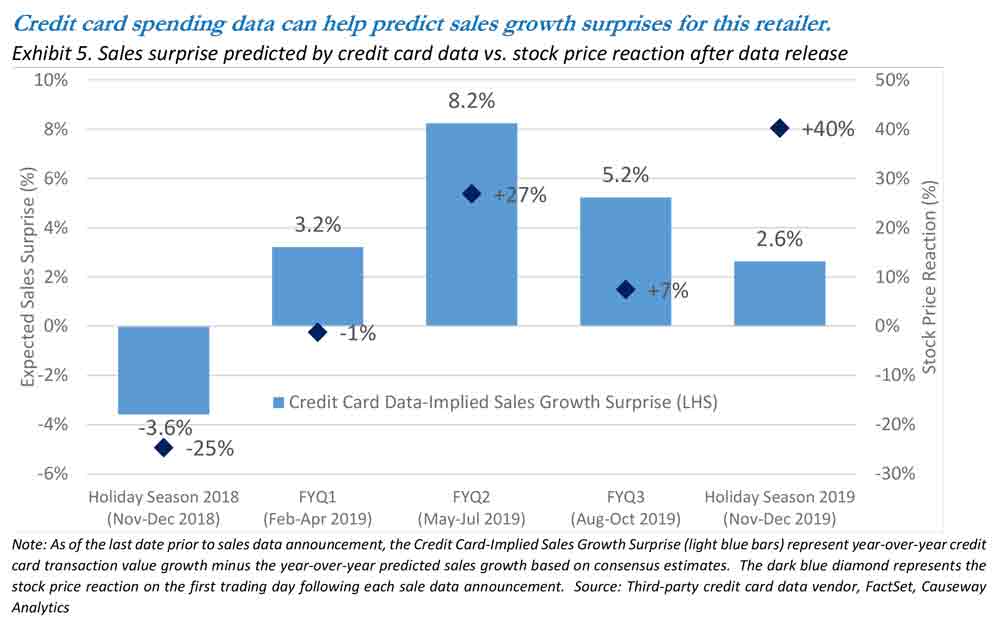
We observed a high efficacy rate for one specific U.S. retailer. This retailer has struggled with operational challenges in addition to the typical structural change facing all retailers. As a result, sales and earnings announcements tend to move the stock significantly (in both directions). With the credit card data in hand, we could monitor daily changes in the year-over-year sales growth and compare the trend with sell-side estimates for the quarter. If the credit card data were to indicate growth in excess of sell-side estimates, a positive “surprise” might be in store and we would expect the stock to rally once actual sales are reported.
The light blue bars in Exhibit 5 chart the difference between the credit-card-implied sales growth and sell-side expectations for sales growth as of the day before the company announced its actual results. We focus here on all announcements over the last year (from January 2019 to January 2020). In addition to normal quarterly announcements, the company makes a special disclosure of its holiday sales (November and December) since these months compose the majority of annual sales. For each reported period, we then compare the predicted “surprise” to the stock’s reaction on the next day of trading (plotted as the dark blue diamond in the chart). These two variables exhibit a close relationship.
Our fundamental analysts already believed that the stock offered significant valuation upside, and since credit card data indicated higher sales growth than consensus, we had the conviction to add to this position in December in our fundamental strategies.
After reported sales growth for the Holiday 2018 period disappointed expectations (and the stock price fell 25% on the next trading day), many investors were rightly nervous one year later just before the release of Holiday 2019 data. Our fundamental analysts already believed that the stock offered significant valuation upside, and since credit card data indicated higher sales growth than consensus, we had the conviction to add to this position in December in our fundamental strategies. The stock rose significantly after the company reported its holiday season sales statistics in January 2020. Given the effectiveness of this example and others, we plan to consider aggregated credit card data for a wide array of stocks exhibiting sensitivity to consumer spending trends.
Summary
Much has changed in quantitative investing in recent years given the ever-expanding sea of data and the adoption of new technologies such as artificial intelligence and machine learning. Despite computational advances, we believe that human judgment and interpretation have become more important than ever to avoid new pitfalls and confront the challenges of unstructured and big data. While we believe Causeway has the tools and expertise to analyze the vast majority of available data, we are committed to treading prudently and maintaining our high research standards. We have highlighted four recent quantitative projects that we believe strike this balance, and we continue to research new ideas to improve the inputs for all our strategies.
[1] The Eurekahedge AI Hedge Fund Index has underperformed both the flagship Eurekahedge HF Index and the MSCI World Index over the prior 1- and 3-year periods ended 12/31/2019.
This market commentary expresses Causeway’s views as of February 2020 and should not be relied on as research or investment advice regarding any stock. These views and any portfolio holdings and characteristics are subject to change. There is no guarantee that any forecasts made will come to pass. Forecasts are subject to numerous assumptions, risks, and uncertainties, which change over time, and Causeway undertakes no duty to update any such forecasts. Information and data presented have been developed internally and/or obtained from sources believed to be reliable; however, Causeway does not guarantee the accuracy, adequacy, or completeness of such information.
International investing may involve risk of capital loss from unfavorable fluctuations in currency values, from differences in generally accepted accounting principles, or from economic or political instability in other nations.
Certain examples refer to backtested information. Causeway does not currently manage assets purely using these techniques. There are numerous inherent limitations in the use of simulated information, including that it may not reflect the impact that material economic and market factors might have had on the portfolio managers’ decision making if they were actually managing accounts using these techniques. The simulated information does not reflect contemporaneous trading, fees, or any transaction costs. Simulated information may not be indicative of the future results of any portfolio, and other periods selected may have different results. There can be no assurance that a portfolio using the techniques described would achieve profits or avoid incurring substantial losses.
“Alpha” means performance exceeding the benchmark index.
The MSCI World Index is a free float-adjusted market capitalization index, designed to capture large and mid-cap segments across 23 developed markets countries. The MSCI Emerging Markets Index is a free float-adjusted market capitalization index, designed to measure the performance of the large and mid-cap segments of 26 emerging markets countries. These MSCI indices are gross of withholding taxes, assume reinvestment of dividends and capital gains, and assume no management, custody, transaction, or other expenses. It is not possible to invest directly in an Index. MSCI has not approved, reviewed, or produced this report, makes no express or implied warranties or representations, and is not liable whatsoever for any data in the report. You may not redistribute the MSCI data or use it as a basis for other indices or investment products.
The Eurekahedge AI Hedge Fund Index is an equally weighted index of 27 constituent funds. The index is designed to provide a broad measure of the performance of underlying hedge fund managers who utilize artificial intelligence and machine learning theory in their trading processes. The Eurekahedge Hedge Fund Index is Eurekahedge’s flagship equally weighted index of 2,389 constituent funds. The index is designed to provide a broad measure of the performance all underlying hedge fund managers irrespective of regional mandate.