Contact Us
Subscribe to Causeway Insights, delivered to your inbox.
“I don’t think rates will rise in the foreseeable future, maybe never again in my lifetime.” National Economic Council Director Larry Kudlow, April 11, 2019
No spring chicken, Director Kudlow may be right. However, what if he’s wrong? Cycles tend to turn when least expected. Clearly, the past decade of massive global monetary accommodation has produced side effects such as asset inflation, fiscal deficits, and rising levels of private and public sector debt. According to asset tracker Preqin, global private capital “dry powder“ (money not yet invested) has reached a record $2 trillion. Of that, committed—but as of yet undeployed—capital for private equity is estimated to be $1.2 trillion—over 20% of the $5 trillion of global private equity capital.
As the pace of monetary liquidity expansion slows, we expect rewards for those engaging in price discovery and identifying undervaluation.
Perhaps too much money is chasing too few (good) investments. We observe a similar excess liquidity effect in public equity markets, as investors generally appear indifferent to valuation in their efforts to gain exposure to growth. As the pace of monetary liquidity expansion slows, we expect rewards for those engaging in price discovery and identifying undervaluation.
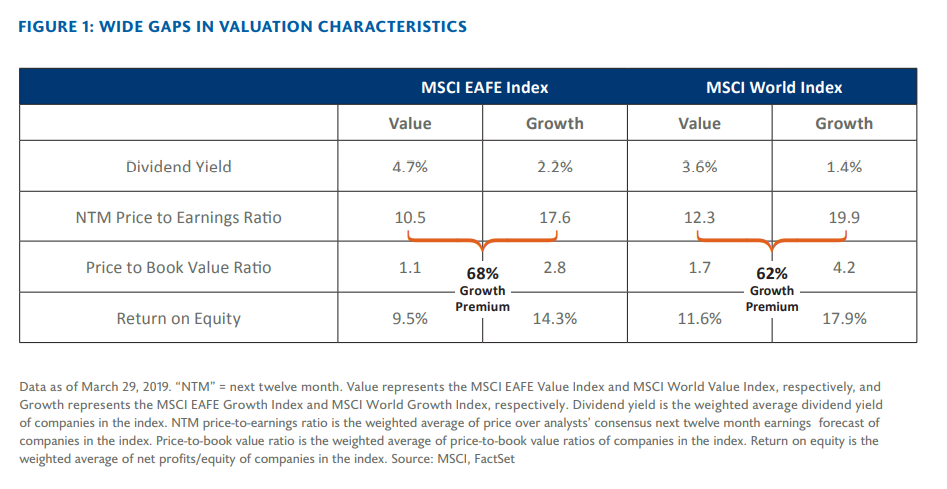
The “New Normal” strikes us as abnormal. Those early in their careers in the US bond market have only experienced the term premium (the extra return investors demand to compensate them for the risk associated with a long-term bond) declining steadily for the past eight years. The US bond term premium is at a 15-year low. We believe this shrinking risk premium has helped depress equity market volatility and support higher equity valuations. Over the past decade to March 31, 2019, the MSCI USA Index has returned nearly 16% per annum, on average. This return is generous for a developed markets index, particularly given the shrinking risk, measured as volatility. The 10-year rolling realized annual US equity market volatility is now at its lowest point in history. The less technology-endowed, more cyclical MSCI EAFE Index has delivered about 10% per annum, on average, over the decade. In all regions, value stocks have underperformed growth stocks for much of this post-2008 period, resulting in historically wide gaps in characteristics between value and growth indices (See Fig. 1).
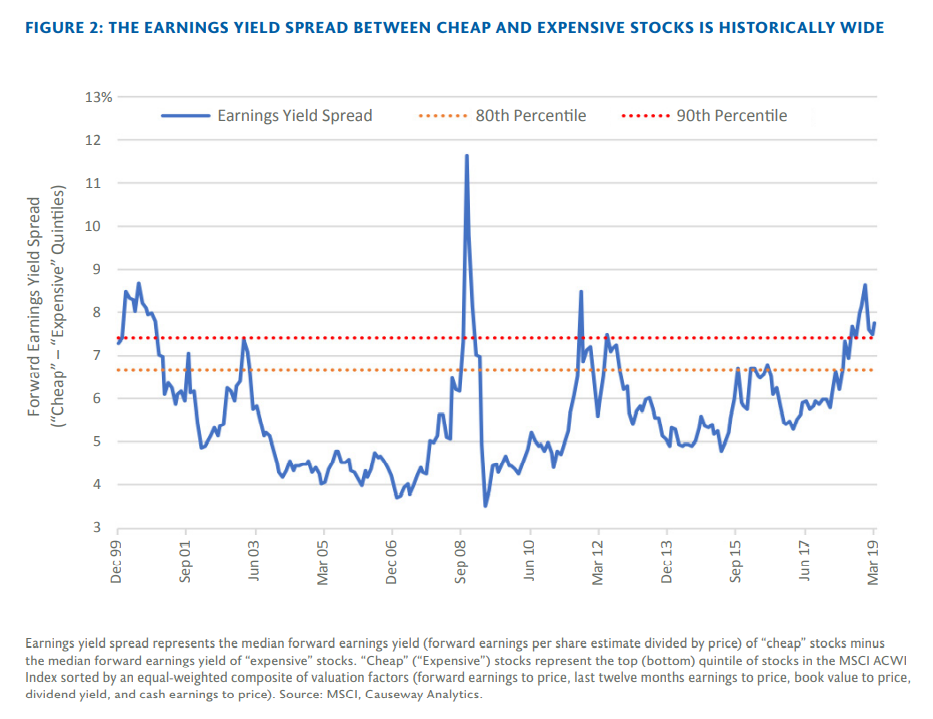
Additionally, the earnings yield spread in the MSCI All Country World Index (“ACWI”), which measures the earnings yield of the cheapest stocks minus the earnings yield of the most expensive stocks, currently is historically wide, above the 90th percentile (See Fig. 2).

At some point, extremely depressed valuations should inspire buyers to snap up the bargains.
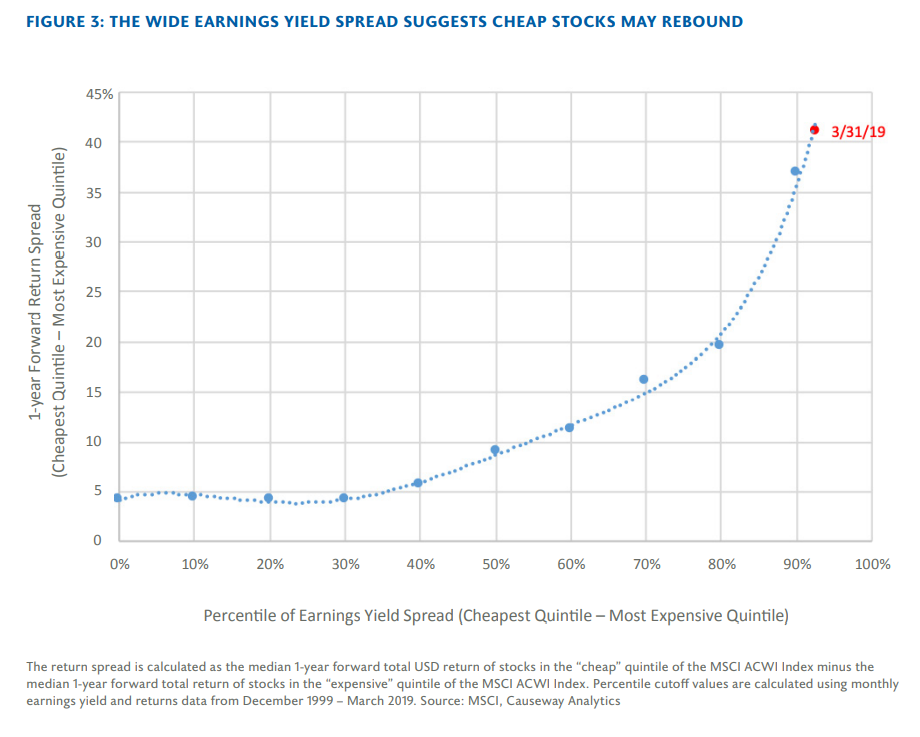
By analyzing the MSCI ACWI stock universe since 2000, we see that the earnings yield spread differential has been correlated with future performance. When the earnings yield spread has reached extreme levels—90th percentile or above—cheap stocks have outperformed expensive stocks by over 40% in the next 12 months. At some point, extremely depressed valuations should inspire buyers to snap up the bargains. At the end of March 2019, the earnings yield spread was in the 93rd percentile (See Fig. 3).
With the end of quantitative easing for this cycle, the US Federal Reserve Bank has reduced its balance sheet by about 11% from its peak of approximately $4.5 trillion. We expect that tapering liquidity growth will coincide with a rise in investor risk aversion, perhaps evidenced by a widening of global high yield bond spreads over US Treasury bills. The latter have a significant negative correlation with global price-to-earnings ratios. We believe the valuation gap in global equity markets will narrow as global monetary liquidity growth slows further, and as the debt service burden increases across much of the developed world and China. Public sector financing may crowd out private sector credit. Under that scenario, the cost of financing will rise.
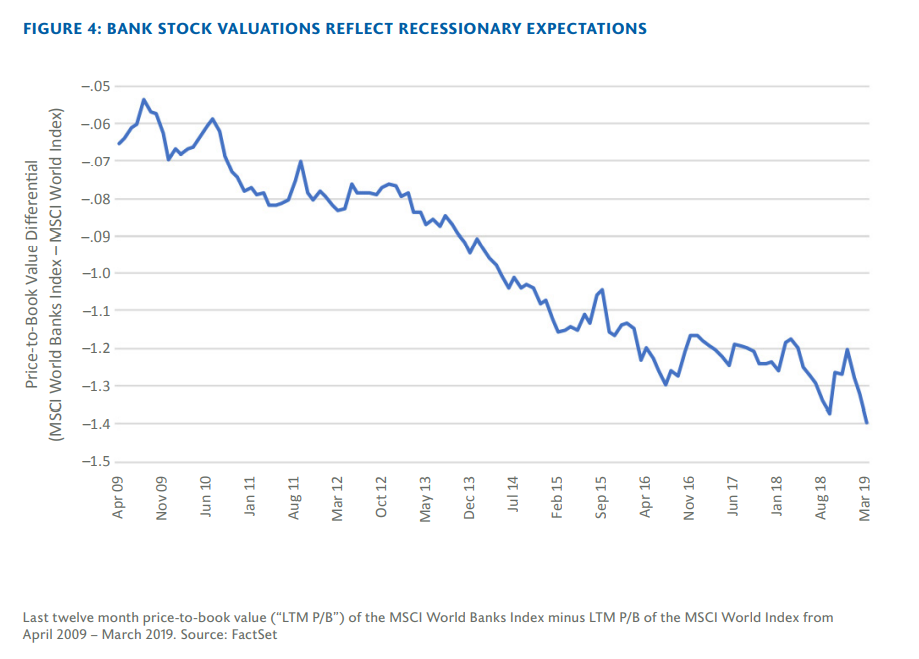
Shrinking monetary liquidity—or any one of several possible macroeconomic shocks—could precipitate a recession in major economies globally. In our estimate, a moderate recession is already priced into many cyclical stocks. At present, value stocks tend to be cyclical, and cyclical stocks are trading at one of the largest discounts to defensive stocks in the past two decades. The most undervalued stocks in many markets globally trade at price-to-earnings and price-to-cash flow multiples consistent with a deteriorating economic cycle and structural disruption. Banks, much maligned in a period of falling interest rates, already discount some very bad news. This is reflected in the price-to-book value differential between bank stocks and the broader MSCI World Index (See Fig. 4). Energy stocks also are trading at historically depressed levels.
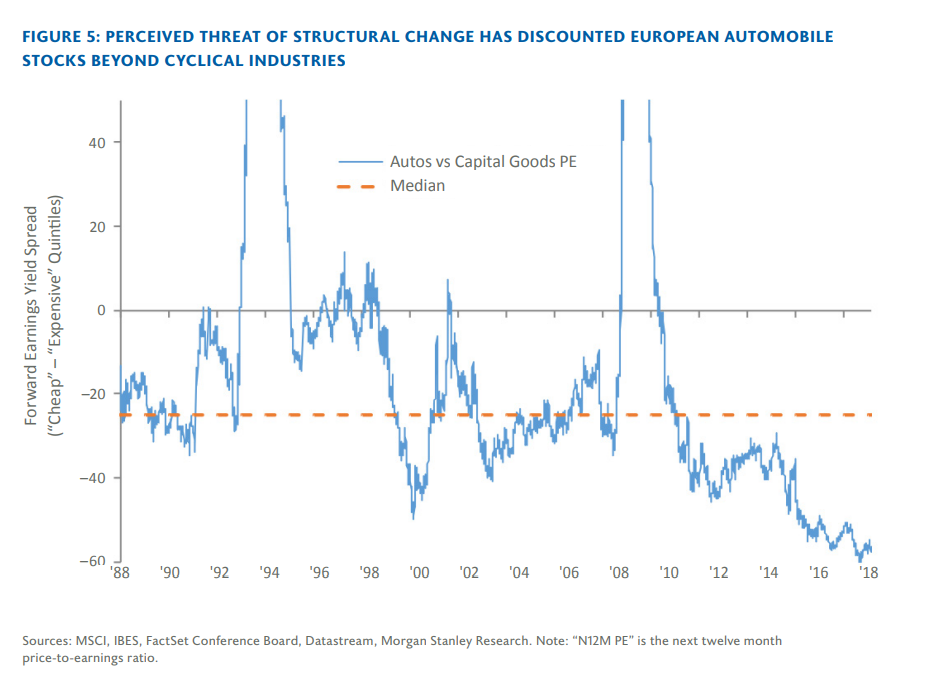
Some industries are so unpopular, considered rife with structural change, that they have tumbled in valuation. For example, European automobile stocks are trading at meager valuations versus history and relative to other cyclical segments of the markets, such as capital goods (See Fig. 5).

Stretched earnings yield spreads between cheap and expensive stocks suggest value is due for a resurgence, although timing cannot be predicted.
In our view, growth stocks with no (or negative) earnings, and no near-term prospect of profitability, may have more in common with venture capital than traditional publicly listed equities. We believe that valuation multiple expansion (especially price-to-sales) is unsustainable, as earnings revisions are turning negative in many sectors and regions. In contrast with growth, the value factor commands a risk premium because market action does not typically re-price these stocks quickly to fair market value. Often, it takes years for a value stock to trade at fair market value. That requires patience, and makes timing of the value cycle difficult.
If history is any guide, when money is too cheap for a prolonged period, financial leverage rises, labor and capital resources get misdirected, and the financial system becomes even more vulnerable to any modest tightening. A steeper yield curve may lower recession concerns, but at the expense of higher volatility and lower valuation multiples.
From Causeway quantitative research, we see that value is not dependent on either the economic or market regime. Stretched earnings yield spreads between cheap and expensive stocks suggest value is due for a resurgence, although timing cannot be predicted. If interest rates do increase, reversing the trend after 2008, this would likely support value stocks, which tend to outperform growth when interest rates rise. For many growth stocks, earnings and cash flow are promised far into the future, which makes them the most sensitive to fluctuations in interest rates. In a rising rate environment, these long duration growth stocks typically swoon. As part of our fundamental research process, we encourage our portfolio companies to generate surplus cash flow, and return as much of that to shareholders as soon as possible. With the liquidity spigot turned lower, the markets may once again agree with our view.
This market commentary expresses Causeway’s views as of April 22, 2019 and should not be relied on as research or investment advice regarding any investment. These views and any portfolio holdings and characteristics are subject to change, and there is no guarantee that any forecasts made will come to pass. Any securities identified do not represent all of the securities purchased, sold or recommended by Causeway. The reader should not assume that an investment in any securities identified was or will be profitable. Forecasts are subject to numerous assumptions, risks and uncertainties, which change over time, and Causeway undertakes no duty to update any such forecasts. Information and data presented has been developed internally and/or obtained from sources believed to be reliable; however, Causeway does not guarantee the accuracy, adequacy or completeness of such information.
The MSCI World Index is a free float-adjusted market capitalization index, designed to measure developed market equity performance, consisting of 23 developed country indices, including the US. The MSCI ACWI Index is a free float-adjusted market capitalization index, designed to measure the equity market performance of developed and emerging markets, consisting of 23 developed country indices, including the US, and 24 emerging market country indices. The MSCI World Value Index and MSCI ACWI Value Index are a subset of the MSCI World Index and MSCI ACWI Index, respectively, and target 50% coverage of the relevant index, with value investment style characteristics for index construction using three variables: book value to price, 12-month forward earnings to price, and dividend yield. The MSCI World Growth Index and MSCI ACWI Growth Index are a subset of the MSCI World Index and MSCI ACWI Index, respectively, and target the remaining 50% coverage. The MSCI EAFE Index is a free float-adjusted market capitalization weighted index, designed to measure developed market equity performance excluding the US and Canada, consisting of 21 stock markets in Europe, Australasia, and the Far East. The MSCI USA Index is designed to measure the performance of the large and mid cap segments of the US market. With 631 constituents, the index covers approximately 85% of the free float-adjusted market capitalization in the US. The indices are gross of withholding taxes, assume reinvestment of dividends and capital gains, and assume no management, custody, transaction or other expenses. It is not possible to invest directly in an Index.
MSCI has not approved, reviewed or produced this report, makes no express or implied warranties or representations and is not liable whatsoever for any data in the report. You may not redistribute the MSCI data or use it as a basis for other indices or investment products.