Contact Us
Subscribe to Causeway Insights, delivered to your inbox.
We have never seen anything like this. Governments and their central banks injected approximately $30 trillion of fiscal and monetary stimulus into the global economy from February 2020 to the end of 2021. In the United States, the M2 measure of money supply increased more than 40% over roughly the same period. Ultra-stimulative policy has inflated prices across asset classes, including global equities. With the cost of money (interest rates) dwindling to zero, investors have preferred long-dated cash flows to payments today, causing speculative growth stocks to flourish. It has been a long winter for value investors.
Key insights
- As discount rates rise, valuation should reassert its role in equity markets.
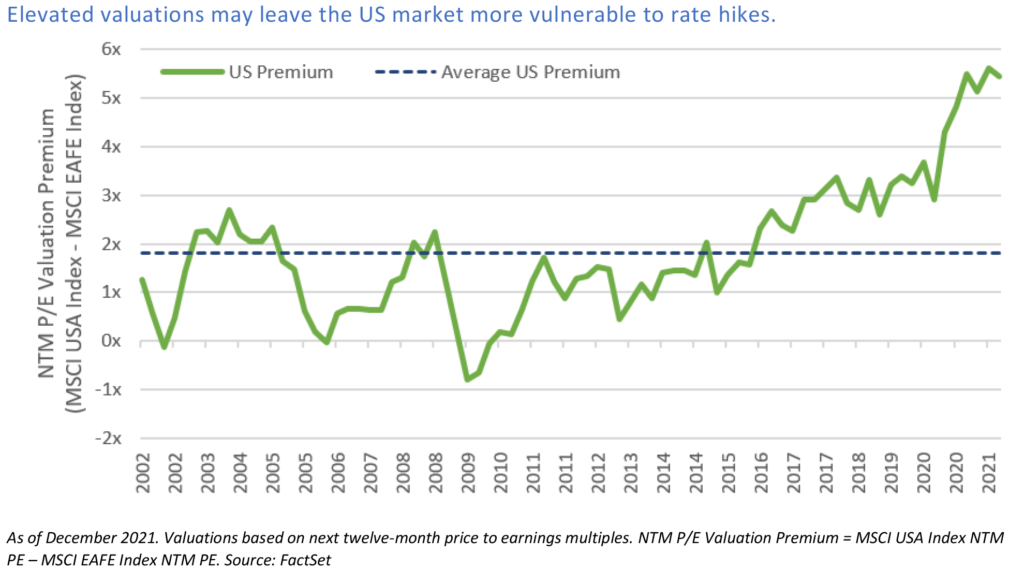
- With the Federal Reserve driving this tightening cycle, we believe the valuation “right-sizing” process may be more severe in the United States.
- Against a backdrop of macroeconomic uncertainty, dividends and share buybacks consistently represent a sizable portion of total return.
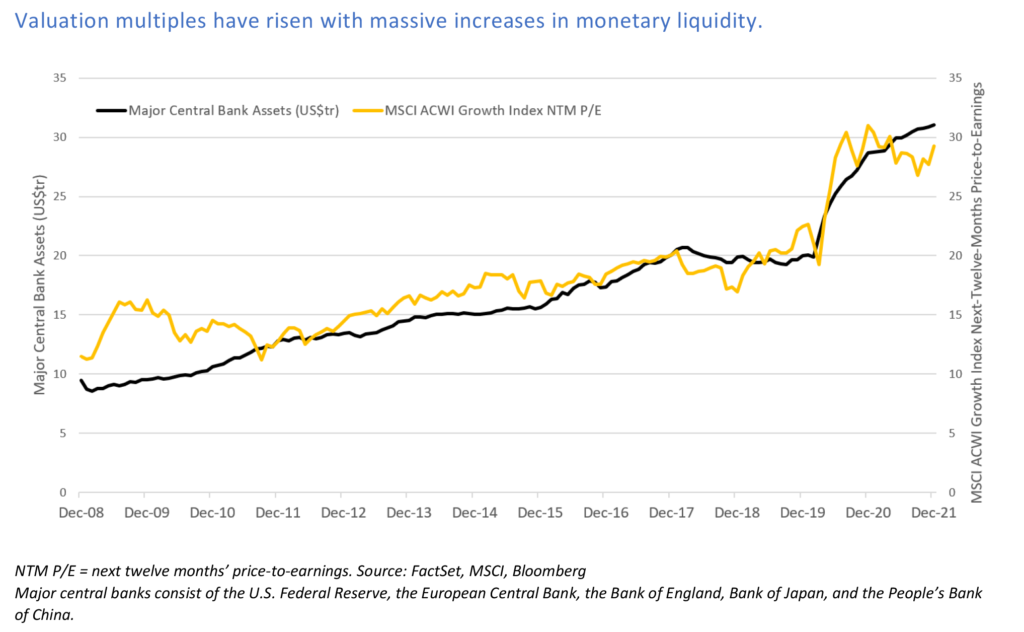
But after unprecedented expansion, global liquidity appears likely to shrink. Inflation is forcing the hands of the US Federal Reserve, the European Central Bank, and the Bank of England. Governments globally are preparing to pull back pandemic public sector spending. Declining liquidity should test the independence of central banks and reveal whether financial repression—the use of quantitative easing to finance fiscal deficits—will continue. For value to outperform growth, central banks must signal they will not rescue securities markets. In our view, 2022 is the year when central banks and politicians recognize that a withdrawal of stimulus to rein in goods & services inflation must also slow asset price inflation. A stock has a direct and inescapable relationship to cash flows, specifically the present value of the cash the company can generate into perpetuity. As the rate to discount future cash flows rises, both in nominal and real terms, valuation should reclaim center stage in global equity markets.
As the rate to discount future cash flows rises, both in nominal and real terms, valuation should reclaim center stage in global equity markets.
Far cheaper than their US counterparts, international equities may fare better as monetary support is withdrawn. In our view, the US equity exchanges are home to some of the most notable valuation offenders, with “nosebleed” multiples and cash-burning business models. With the Federal Reserve driving this tightening cycle, we believe the valuation “right-sizing” process may be more severe in the United States. The more dovish European Central Bank and Bank of Japan may elicit calmer market responses. Meanwhile, the central banks of nearly all emerging markets (exceptions include China and Turkey) have been steadily hiking rates for the last year, helping insulate their currencies from US monetary pressure and potentially making those markets more attractive for US dollar-based investors.
Our investment team can draw parallels between this cycle and the 1970s stagflation, or the early 2000s growth bubble bursting, but the current era has unique characteristics. After sinking interest rates spurred years of valuation multiple expansion, we now are observing a de-rating. As the macroeconomic backdrop shifts, our role as an active manager remains rooted in intensive research, disciplined stock ranking, and risk control.
After sinking interest rates spurred years of valuation multiple expansion, we now are observing a de-rating.
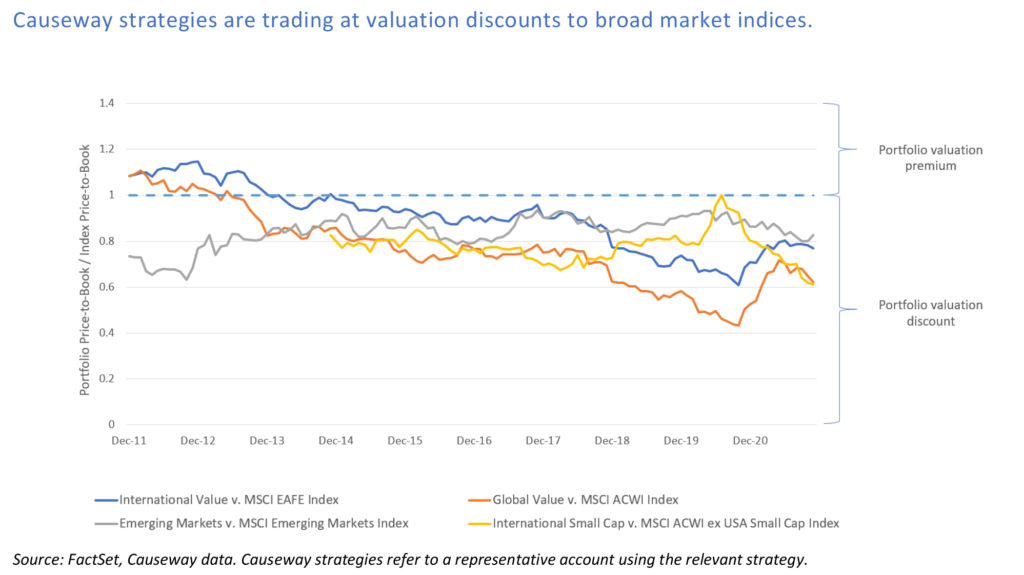
Many well-managed, competitively positioned companies with reasonable valuation multiples (often cheaper than the overall market) have risen to the top of our risk-adjusted ranking for international and global value equity portfolios and have the largest weights in our multi-factor emerging markets and international small cap strategies.
Causeway fundamental global and international portfolios include, in our view, rigorously researched beneficiaries of an eventual Covid recovery, including market leaders in travel software, leisure, aviation, and aerospace. We currently believe these portfolio holdings will meaningfully grow their earnings over the next two to three years, and that their balance sheets are strong enough to sustain them through the remainder of the pandemic. We continue to employ price discipline around companies in “traditional value” sectors including financials and energy. As bottom-up active managers, it is not enough simply to own stocks in sectors that have outperformed in prior rising rate environments. If persistent inflation dents consumer demand and monetary authorities become more hawkish, economic activity could slow. Particularly for companies further along in their earnings cycle, we are scrutinizing the degree to which their valuations can accommodate moderating earnings growth. We believe holdings in pharmaceutical and consumer industries complement these cyclical exposures with some of the portfolios’ highest dividend yields and economically resilient cash flows.
As bottom-up active managers, it is not enough simply to own stocks in sectors that have outperformed in prior rising rate environments.
Causeway quantitative portfolio managers see potential for value in emerging markets and international small cap equities. Here too, as inflation and interest rates rise, the investment cases weaken for “story stocks” with profits and cash flows pushed far into the future. Causeway quantitative strategies seek growth, but our multi-factor alpha approach aims to ensure that growth is underpinned by earnings, and that growth stocks selected for client portfolios have reasonable valuations.
Across Causeway’s global and international and emerging markets and international small cap strategies, we continue to emphasize companies rewarding shareholders via dividends and share buybacks. Against a backdrop of macroeconomic uncertainty, these forms of capital return to shareholders consistently represent a sizable portion of total return. As valuation reasserts itself, we expect rewards for those engaging in price discovery and identifying undervaluation.
This market commentary expresses Causeway’s views as of February 2022 and should not be relied on as research or investment advice regarding any stock. These views and any portfolio holdings and characteristics are subject to change. There is no guarantee that any forecasts made will come to pass. Forecasts are subject to numerous assumptions, risks, and uncertainties, which change over time, and Causeway undertakes no duty to update any such forecasts. Information and data presented has been developed internally and/or obtained from sources believed to be reliable; however, Causeway does not guarantee the accuracy, adequacy, or completeness of such information.
International investing may involve risk of capital loss from unfavorable fluctuations in currency values, from differences in generally accepted accounting principles, or from economic or political instability in other nations.
M2 is a measure of the money supply that includes cash, checking deposits, and easily convertible “near money.” “Near money” refers to savings deposits, money market securities, mutual funds, and other time deposits.
The MSCI ACWI Index is a free float-adjusted market capitalization index, designed to measure the performance of the large and mid-cap segments across 23 Developed Markets and 26 Emerging Markets countries. The MSCI ACWI Growth Index is a subset of the MSCI ACWI Index, and targets 50% coverage of the MSCI ACWI Index, with growth investment style characteristics for index construction using five variables: long-term forward EPS growth rate, short-term forward EPS growth rate, current internal growth rate, long-term historical EPS growth trend, and long-term historical sales per share growth trend . MSCI ACWI ex USA Small Cap Index captures small cap representation across 23 Developed Markets and 25 Emerging Markets countries. The MSCI EAFE Index is a free float-adjusted market capitalization index, designed to measure the performance of the large and mid-cap segments across 21 Developed Markets countries. The MSCI USA Index is a free float-adjusted market capitalization index, designed to measure the performance of the large and mid-cap segments of the US market. The MSCI Emerging Markets Index captures large and mid cap representation across 25 Emerging Markets countries. These MSCI indices are gross of withholding taxes, assume reinvestment of dividends and capital gains, and assume no management, custody, transaction or other expenses. It is not possible to invest directly in an Index.
MSCI has not approved, reviewed, or produced this report, makes no express or implied warranties or representations and is not liable whatsoever for any data in the report. You may not redistribute the MSCI data or use it as a basis for other indices or investment products.