


Contact Us
Subscribe to Causeway Insights, delivered to your inbox.
Weather extremes shaped this summer. Western Europe recorded its hottest June on record; wildfire smoke darkened America’s spacious skies; a Causeway client in Winnipeg experienced extreme heat followed by a hailstorm powerful enough to shatter windshields. “It’s been wild. Like the markets,” the client said.
Indeed. The AI trade excelled, unwound and revved up again. Brent crude futures swung almost 40% in two months. South Korea’s KOSPI index nearly tripled from its 2025 lows before tumbling, pushing year-to-date volatility above 60%—higher than Bitcoin’s.
Reversals can feel exceptional in the moment, but our research suggests they are an enduring feature of markets. That insight informs Causeway’s multi-factor alpha approach across our quantitative equity strategies, including Emerging Markets, International Small Cap, Global Small Cap, and Global Systematic Equity.
The long histories for the Causeway Emerging Markets and International Small Cap strategies provide a useful lens into changing market regimes. Since their respective inceptions in 2007 and 2014, market leadership has shifted regularly across value and growth, large and small caps, momentum, quality, yield-curve environments, currencies and commodities.
As the accompanying style tables illustrate, sustained leadership is rare: over the past decade, the annual leader changed in 100% of year-to-year periods in emerging markets and 78% of year-to-year periods in international small caps. Just as importantly, styles that lead in one period can quickly find themselves lagging in another.
Key insights
- Market leadership rarely stands still.
- Abrupt reversals can challenge concentrated exposures.
- Diversified alpha can support resilience across regimes.
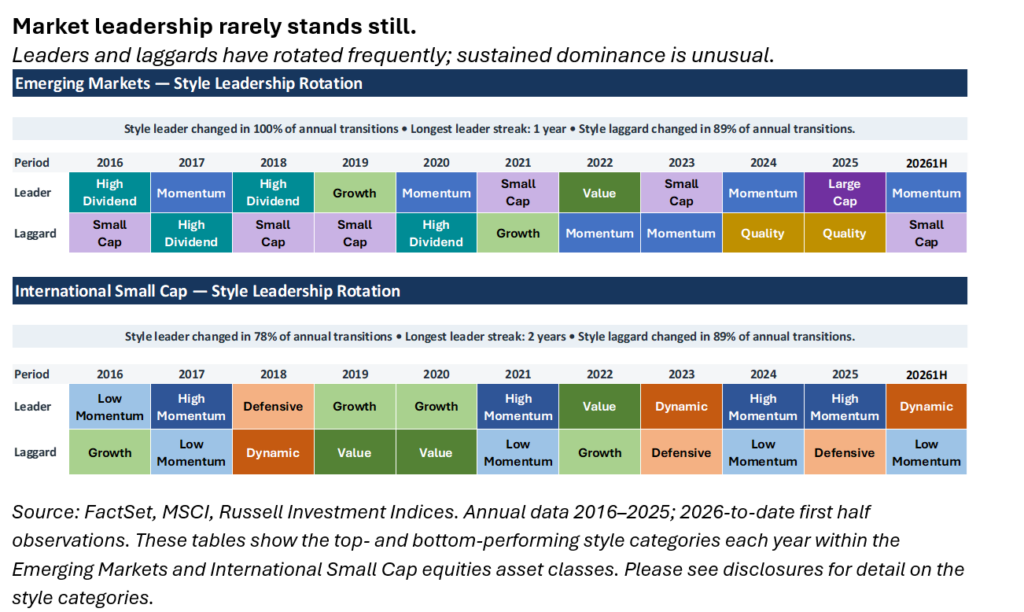
Rotations may be common, but not all are created equal. Some regime changes are relatively benign; others are severe enough to overwhelm a concentrated exposure. Momentum reversals are a prime example: they occur episodically, but when they do, the drawdowns can be unusually abrupt. These effects can be especially pronounced in less efficient markets such as emerging markets and small caps, where liquidity and the dispersion of individual stock outcomes can magnify sudden shifts in leadership.
Rotations may be common, but not all are created equal.
For quantitative strategies reliant on a one-note approach, those episodes can translate into abrupt swings in performance. Causeway’s quantitative strategies are deliberately designed to be different. Our alpha models combine multiple, relatively low-correlated factor groups, seeking what we call regime stability. Different sources of alpha are designed to contribute in different market environments with a goal of a more diversified and resilient return stream. Our historical results have borne this out.
International Small Cap:
Causeway’s International Small Cap strategy has generated positive median excess returns across every market regime shown, including both sides of value/growth, momentum/reversal, quality, yield-curve, currency, oil and commodity environments. Results have been particularly strong during value and momentum-led markets, while remaining positive in their opposing regimes—including essentially neutral, but still positive, median alpha during momentum reversals.
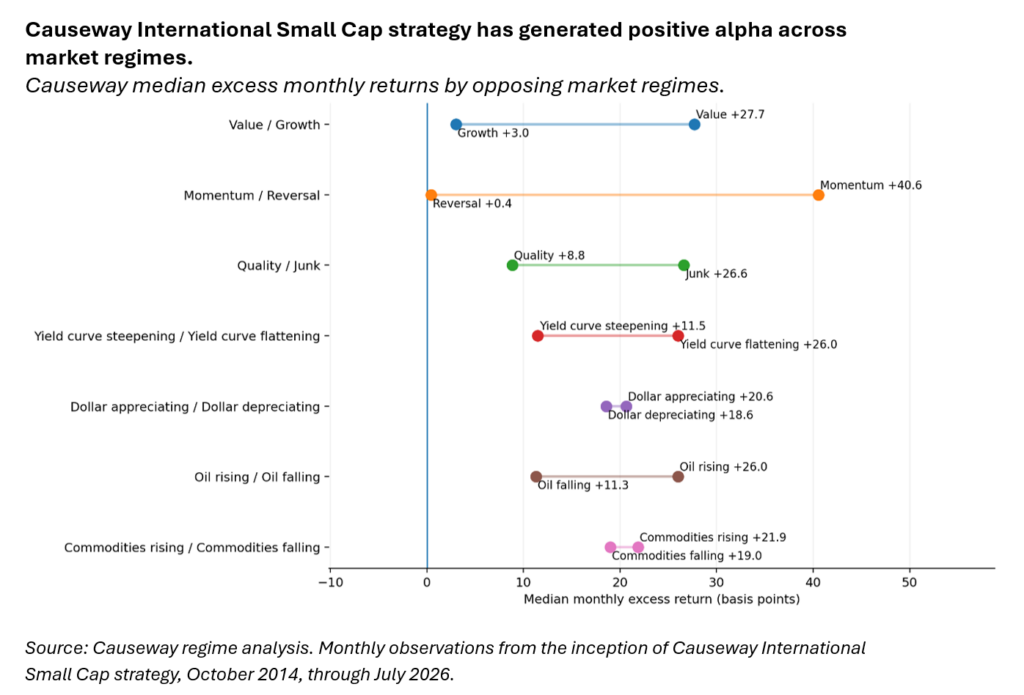
Causeway’s alpha models combine multiple, relatively low-correlated factor groups, seeking what we call regime stability.
Emerging Markets:
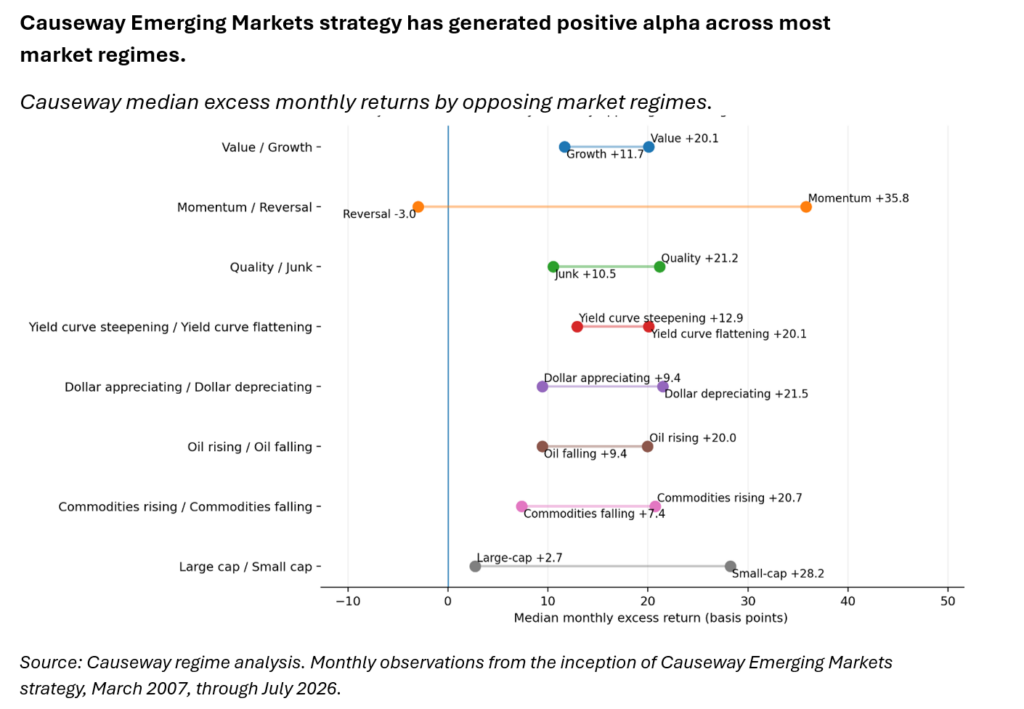
A similar pattern emerges in Causeway’s Emerging Markets strategy. Median excess returns have been positive across nearly every market regime shown, with particularly strong results when value and small caps have led. Momentum reversals are the exception: the strategy’s median excess return was -0.03% in months when momentum underperformed, compared with a -1.06% median relative return for momentum itself.
Causeway cannot predict the market’s next season any better than the next investor. Nor do we believe we need to. Across our quantitative strategies we have built diversified alpha processes that seek independence from any one market environment, or any one source of alpha. Different factors will lead at different times, and some will inevitably struggle. By combining multiple, relatively low-correlated sources of alpha, we seek to participate when conditions favor a particular signal while limiting the portfolio’s dependence on it when the weather changes.
This market commentary expresses Causeway’s views as of September 2026 and should not be relied on as research or investment advice regarding any stock. The views herein represent an assessment of companies at a specific time and are subject to change. There is no guarantee that any forecast made will come to pass. This information should not be relied on as investment advice and is not a recommendation to buy or sell any security. The securities identified and described do not represent all of the securities purchased, sold, or recommended for client accounts. Our investment portfolios may or may not hold the securities mentioned. The reader should not assume that an investment in the securities identified was or will be profitable. For full performance information regarding Causeway’s strategies, please see www.causewaycap.com. For further information on the risks regarding investing in Causeway’s strategies, please go to https://www.causewaycap.com/wp-content/uploads/Risk-Disclosures.pdf.
Causeway returns are based on the net asset value of a representative mutual fund account using the Causeway International Small Cap and Causeway Emerging Markets strategies, respectively. Representative account inception is 3/30/07 (for Emerging Markets) and 10/20/14 for International Small Cap. The performance data quoted herein represents past performance. Past performance is not a guarantee of future results. Total returns assume reinvestment of dividends and capital gains distributions at net asset value when paid.
“Benchmark” refers to the MSCI Emerging Markets Index or the MSCI ACWI ex-US Small Cap Index, and its variants as follows. “Value/Growth Months” refers to months in which the Benchmark Value/Growth Index outperformed the Benchmark. “Large-cap/Small-cap Months” refers to months in which the Benchmark Large Cap / Small Cap Index outperformed the Benchmark. “Momentum Months”/ “Reversal Months” refers to months in which the Benchmark Momentum Index outperformed / underperformed the Benchmark. “Quality Months”/ “Junk Months” refers to months in which the Benchmark Quality Index outperformed / underperformed the Benchmark. “Yield Curve Steepening/Flattening Months” refers to months in which the difference between the yield on the US 10-year Treasury Note and the yield on the US 2-year Treasury Note increased/decreased. “Dollar Appreciating/Depreciating Months” refers to months in which the U.S. Dollar Index (DXY) increased/decreased. “Brent Oil Price Increasing / Decreasing” refers to months in which the USD price of Brent Oil increased or decreased relative to price at the end of the previous month. “Commodities (Ex-Energy) Increasing/Decreasing” is based on the monthly change in the Bloomberg Ex-Energy Commodity Index.
The market leadership table uses the following style categories. For International Small Cap: Value, Growth, Large Cap, Small Cap, Dynamic, Defensive, High Momentum, Low Momentum. “Small Cap” represents MSCI AC World ex USA Small Cap Index. “Value” and “Growth” represent the MSCI AC World ex USA Small Cap Value Index and the MSCI AC World ex USA Small Cap Growth Index, respectively. “Large Cap” represents the MSCI AC World ex USA Large Cap Index. “Dynamic” and “Defensive” represent the geometrically linked float-weighted monthly returns of the top and bottom halves, respectively, of stocks in the MSCI AC World ex USA Small Cap Index based on their beta to the spread between the FTSE Global xUS Large Cap Dynamic Index and the FTSE Global xUS Large Cap De fensive Index returns over the previous 60 months. “High Momentum” and “Low Momentum” represent the geometrically linked float-weighted monthly returns of the top and bottom halves, respectively, of price performers in the MSCI AC World ex USA Small Cap Index over the previous 12 months.
For Emerging Markets: Emerging Markets, Value, Growth, Small Cap, Large Cap, Quality, Low Volatility, Momentum, High Dividend. Emerging Markets is “MSCI Emerging Markets.” “Value” and “Growth” represent the MSCI Emerging Markets Value Index and the MSCI Emerging Markets Growth Index, respectively. “Small Cap” and “Large Cap” represent the MSCI Emerging Markets Small Cap Index and the MSCI Emerging Markets Large Cap Index, respectively. “Quality” and “Low Volatility” represent the MSCI Emerging Markets Quality Index and MSCI Emerging Markets Volatility Tilt Index, respectively. “Momentum” and “High Dividend” represent MSCI Emerging Markets Momentum Index and MSCI Emerging Markets High Dividend Index, respectively.
In addition to the normal risks associated with equity investing, international investing may involve risk of capital loss from unfavorable fluctuations in currency values, from differences in generally accepted accounting principles, or from economic or political instability in other nations. Emerging markets involve heightened risks related to the same factors, as well as increased volatility and lower trading volume. Current and future holdings are subject to risk. For further information on the risks regarding investing in Causeway’s strategies, including unique risks relevant to emerging markets including China and investment structures of certain Chinese companies, please go to https://www.causewaycap.com/wp-content/uploads/Risk-Disclosures.pdf
The MSCI Emerging Markets (“EM”) Index is a free float-adjusted market capitalization index, designed to measure equity market performance of emerging markets, consisting of 26 emerging country indices. The MSCI ACWI ex USA Small Cap Index captures small cap representation across 22 of 23 Developed Markets countries (excluding the US) and 24 Emerging Markets countries. The Indices are gross of withholding taxes, assumes reinvestment of dividends and capital gains, and assume no management, custody, transaction or other expenses.
