Contact Us
Subscribe to Causeway Insights, delivered to your inbox.
Recent years have seen expanding interest in Environmental, Social, and Governance (ESG) issues. Public sentiment on less controversial issues such as oil spills (E), child labor (S), and corporate fraud (G) has mushroomed into a broader consciousness about an array of ESG issues more generally. Investors also have been paying attention, scanning for potential risk, rewards, and value alignment. Many investors ask whether there is a potential tradeoff between return performance and ESG investing. New evidence sheds some light on this question.
In an academic article[1] published in 2016, Mozaffar Khan (who has subsequently joined Causeway) explored the alpha (return in excess of a benchmark) potential of U.S. firms’ ESG momentum.[2] Khan and his coauthors hypothesized that it is important to sift through the large array of ESG issues in order to identify those, termed “Material,” that potentially matter most for alpha in a given industry. In doing so, the authors presented new evidence of significant alpha from investing in firms with high performance on material ESG issues. Key elements of the paper are described below.
1. ESG AND ALPHA
The study was motivated by two observations: (a) there are economic reasons to suggest alpha from ESG performance; and (b) discriminating between material and immaterial ESG issues could purify the alpha signal in firms’ ESG performance.
1a. Economic rationale for alpha potential
It is important to outline the economic mechanism that could link firms’ ESG outperformance to future stock return outperformance. Two conditions are needed for such a link. First, ESG performance should on average be economic value-added in the future, and second, the market must currently underestimate the future value potential.
Economic value potential. The economic value potential of Environmental performance could come from both risk mitigation and opportunity capture. Risks stem from current negative externalities that the firm might be forced to internalize to some extent in the future. For example, carbon emitters and other polluters might be forced in the future to bear disproportionate costs from adverse community action, customer sentiment, regulation, shareholder activism, and reputational damage. Proactive risk mitigation could circumscribe these costs (cash flow effect) and lean against return volatility (risk effect).
Environmental opportunity capture relates to capitalizing on business and innovation opportunities generated by current environmental concerns. Such efforts could result in higher future profits. For example, electric vehicles benefit from, and are a response to, eco-consciousness. Here environmental concerns have led to a new product. As another example, servers in commercial data centers generate a lot of heat and require considerable resources for cooling. Locating such facilities in areas where naturally cooler temperatures and wind can be harnessed for cooling could reduce both energy costs and the eco-footprint.
Social performance could create future value. As an example, investment in employee development and growth could lead to better execution of internal business processes, which could in turn lead to enhanced product and service quality, customer satisfaction, and ultimately profits.[3] For example, there is some evidence that investing in the “Best companies to work for in America” can result in alpha.[4]
Governance mechanisms may also facilitate the preservation of value and a return on shareholder capital.[5] Governance in the abstract is therefore related to economic value axiomatically, although its ultimate effect on value empirically depends on which governance mechanisms, among the many, are installed, and on their effectiveness. For example, effective boards and active ownership by investors could encourage firms to pay out excess cash, thereby removing potential temptation for empire-building or over-investment by corporate executives. In many emerging markets companies, more independent directors on boards could more effectively represent non-family shareholders. Effective compensation contracts could more closely align executives with shareholder risk appetites and, for example, prevent executives from playing it too safe by underinvesting in risky high-return projects. Effective external auditors can provide an independent opinion about the strength of firms’ internal controls and reduce the likelihood of fraud.
Overall, one perspective is that E, S, and G are non-financial measures of performance that, in conjunction with financial measures, provide a more complete dashboard for managers in steering the business towards long-run shareholder value maximization. These non-financial measures may be leading indicators of future financial performance.
The story of course does not end here. There are a number of potential concerns about the relation between ESG and shareholder value. ESG efforts are not expected to be costless and, given diminishing returns to investment, more is not always better. Some ESG efforts might therefore represent over-investment. This is especially problematic if the payback period and return on investment are difficult to assess. For environmental and social efforts, these concerns are easier to see because the outlay costs are more readily observable. For governance as well, more does not always have to be better. For example, a bigger board could hamper timely decision-making and impose other coordination costs. In Japan, companies often have huge, bureaucratic, and static boards of directors, whereas smaller and more nimble boards might be more effective. As another example, excessively restrictive executive compensation policies could hurt a firm’s ability to hire the most talented executives who ordinarily have more employment options. Further, global investors often encourage non-U.S. companies to better align managers with shareholders through stock options and other vesting equity awards. If taken too far, however, management compensation tied to short-term share price performance can lead to myopic investment decisions by managers and rob the company of needed long-term capital expenditures and growth. These arguments motivate some investors’ concerns about the positive alpha potential of firms’ ESG performance.
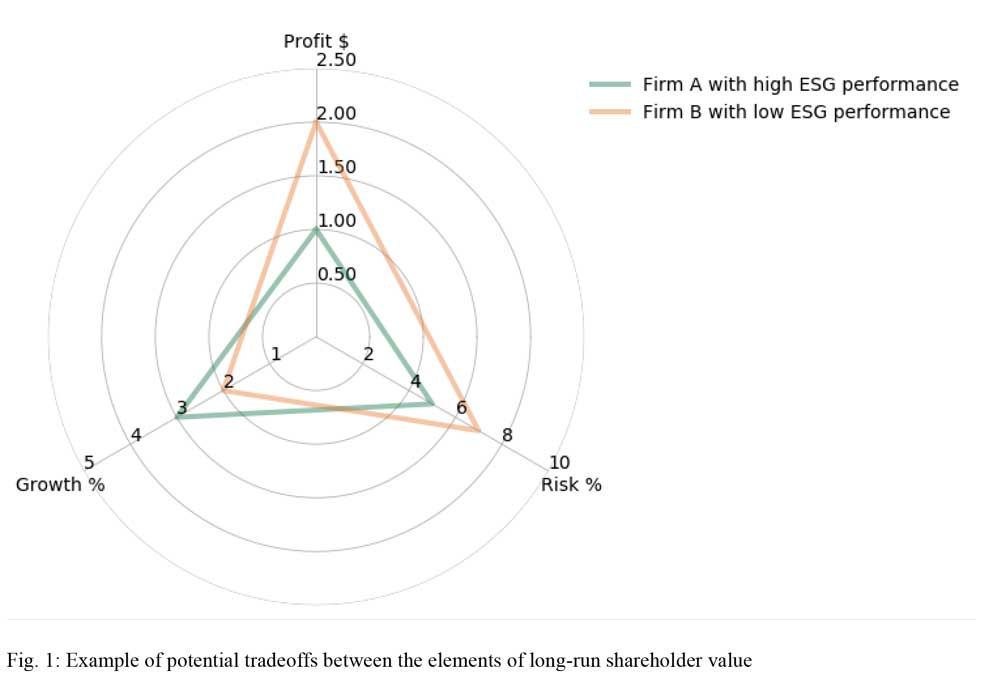
In essence the arguments above suggest alternative ways that ESG efforts might impact the fundamental elements of shareholder value: profitability (CF), future growth (g), and risk (r). On one hand, ESG efforts might lower short-run CF but enhance g and mitigate r, thereby enhancing long-run shareholder value. Equivalently, ignoring ESG might raise CFbut reduce g and raise r, reducing long-run shareholder value. On the other hand, ESG efforts may penalize CF without sufficiently offsetting effects on g and r. Fig. 1 below illustrates some potential tradeoffs between the elements of value. Firm A chooses to spend more on ESG efforts at the cost of lower profits today, but has higher sustainable future growth and lower long-run risk. Firm B chooses to spend less on ESG efforts and enjoys higher profits today, but has lower sustainable future growth and higher long-run risk. Managerial skill and judgment are invoked in calibrating the appropriate choice of CF, g, and r at any given firm.
The upshot is that competing arguments about the potential relation between ESG and alpha provide precisely the tension that makes this an empirical question. We have to look to the data to seek answers. What is the relation between ESG and alpha on average? If the various ESG issues are not equally material for a given industry, would parsing the issues on their materiality give us a better alpha signal?
Mispricing. A second condition for ESG performance to have alpha potential is that the market currently underestimates its future value potential. Such mispricing could result from incomplete disclosures by firms of their ESG efforts (due to, for example, proprietary costs or litigation exposure), difficulty in verifying what is disclosed in the absence of independent attestation, and heterogeneity in investor opinion about the value of ESG.[6]
1b. Materiality of ESG issues
Stakeholders can assess firms on a large array of ESG issues. Which of these issues matter most to shareholders interested in maximizing long-run shareholder value? These issues are referred to below as “material” issues.
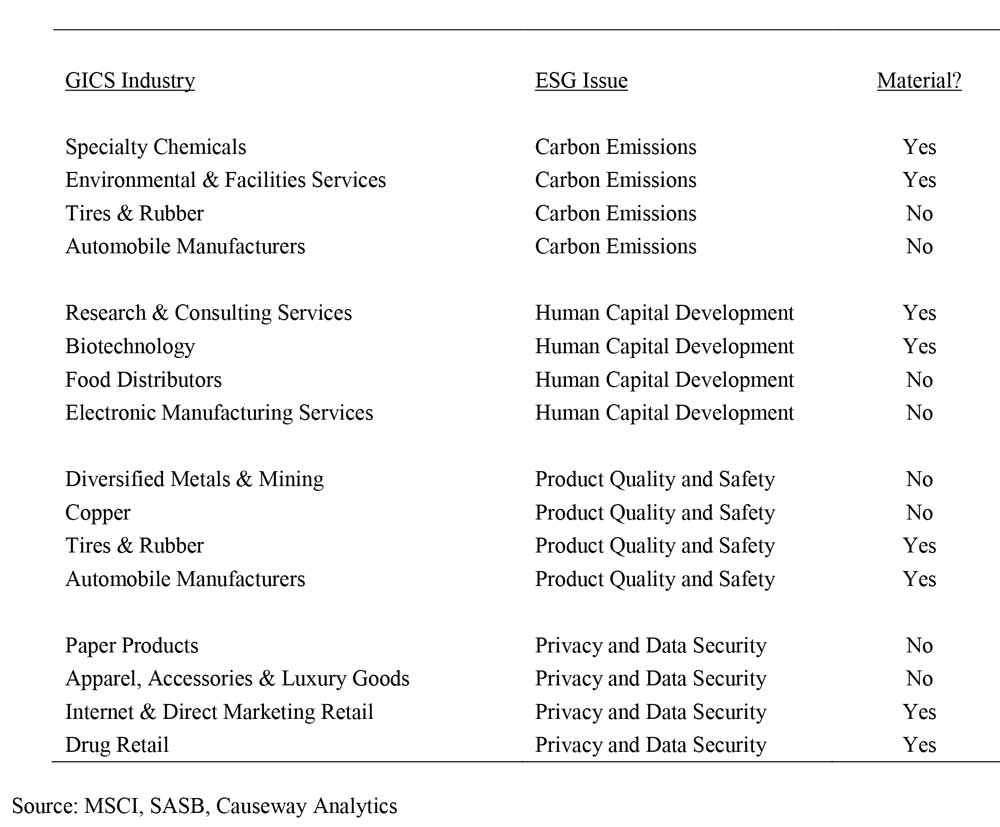
The materiality of ESG issues varies by industry. For example, in the healthcare sector, fuel management is likely a material issue for healthcare distributors (that operate large fleets of trucks and other vehicles) but not for healthcare providers, while access and affordability is likely a material issue for providers but not for distributors.
In the financial sector, access and affordability is likely a material issue for consumer finance companies but not for asset management and custody companies.
In the technology and communications sector, data security and customer privacy is likely a material issue for software and IT service companies but not for electronics manufacturers. Appendix A presents additional illustrative examples of likely material and immaterial issues across selected industries.
The total number of potential ESG issues is large. For example KLD, a leading data source used by Khan et al. (KLD was purchased by MSCI in 2009), rated companies on more than 60 issues. Only some of these issues were likely material for firms in a given industry. As such, the authors hypothesized that discriminating between material and immaterial ESG issues could improve the signal to noise ratio (or purify the alpha signal) in testing for a relation between ESG performance and future stock return performance.
The authors needed to classify ESG issues into material and immaterial, by industry. Such a classification had to be systematic and evidence-based. The authors were in a position to provide evidence on their hypothesis using newly available materiality guidance from a non-profit, the Sustainability Accounting Standards Board (SASB). Generally, SASB adopts a shareholder perspective in identifying material issues as those with evidence of widespread investor interest and expected financial (revenue and cost) impact.[7] However, the effectiveness of SASB’s identification of material issues had not previously been tested.
1c. Data and Sample
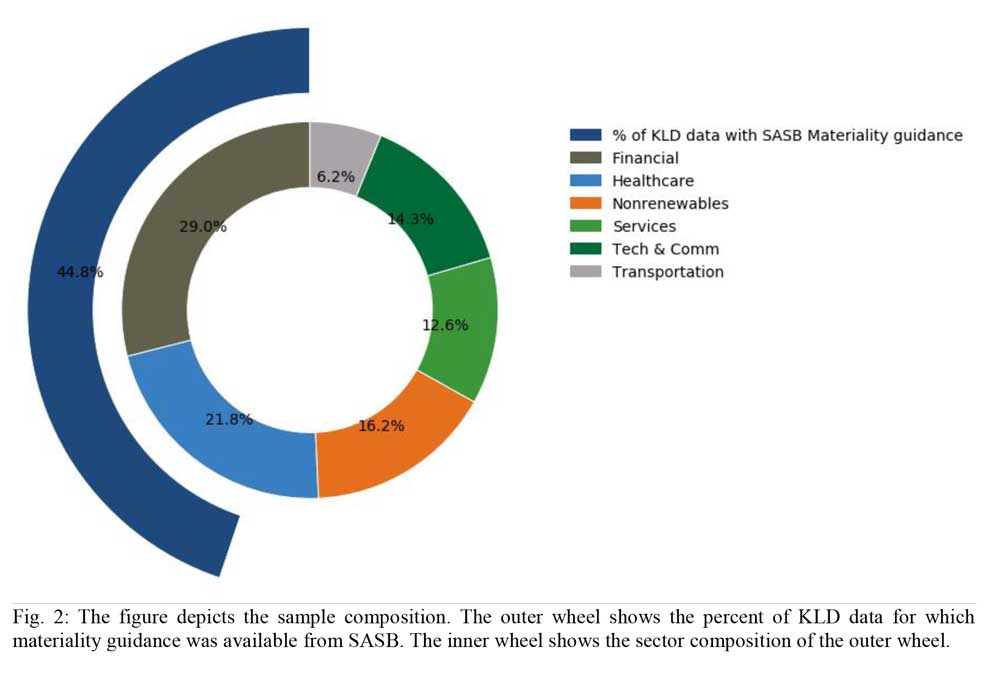
The Khan et al. paper describes the data used by the authors, and this is summarized here. The authors obtained data on material issues by industry from SASB, and firm-level ESG performance scores from KLD. The data in the study was for U.S. firms between 1992 and 2013. As of 2014 when the study was initiated, SASB had issued materiality guidance for six out of ten sectors, covering 45 industries. The final sample included 14,388 firm-years (see their Table 1 for more detail). Fig. 2 below shows the sample composition. The outer wheel shows the percent of available ESG data from KLD for which materiality guidance was available from SASB. The inner wheel shows the sector composition of the outer wheel.
KLD evaluated firms on over 60 ESG issues, and evaluated strengths separately from concerns on each of these issues. It assigned a binary score of 1 or 0 for every firm on its strengths in each ESG issue, and a binary score of 1 or 0 on its concerns. As in prior literature, the authors calculated firm-level ESG scores by subtracting the sum of concerns from the sum of strengths. A negative score for a given firm indicates more concerns than strengths.
Of the more than 60 ESG issues rated by KLD, the number of material issues varied across industries. At the sector level, between 30% and 50% of these issues were considered material by SASB.
The authors calculated firms’ performance on material ESG issues as the sum of strengths minus the sum of concerns on material issues only. Firms’ performance on immaterial issues was calculated similarly.[8] These performance measures were transformed into an alpha signal for portfolio construction in two steps: first, the authors calculated the one-year change in these scores, rendering them as ESG momentum signals; second, the authors regressed the momentum signals on changes in firm characteristics such as size, market-to-book ratio, profitability, leverage, R&D expenditure, institutional ownership, and advertising intensity in order to obtain a residual momentum score uncorrelated with these characteristics. The residual momentum score was used in portfolio construction. Subsequent references to ESG performance scores used in the Khan et al. study are meant to indicate more precisely the residual momentum score just described.
As reported by the authors, their data showed that the full-sample correlation between firms’ total ESG score and their score on material issues was low, whereas the correlation between total ESG score and the score on immaterial issues was high. As a thought experiment, consider the implication if the correlation between total and material ESG scores were exactly equal to 1. In such a case, calculating firms’ material ESG score would be unnecessary because we could simply use their total ESG score. The data showed, in contrast, that the total ESG score has little information about firms’ material ESG score (low correlation), and is mostly informative about firms’ immaterial ESG score (high correlation). This finding was consistent with the expectation that the total ESG score captured less signal (material score) than noise (immaterial score), and therefore that considering firms’ performance on material ESG issues only could yield greater alpha efficacy. Further details on the authors’ research design are presented in Appendix B.
2. RESULTS: MATERIALITY MATTERS
The first key result is the alpha from investing based on firms’ overall ESG score, material ESG score, and immaterial ESG score. Which of these three signals yielded higher alpha? Was the discrimination between firms’ performance on material versus immaterial ESG issues useful?
The authors partitioned the sample of firms into quintiles (_Q) and deciles (_D) based on firms’ performance on all ESG issues, material ESG issues, and immaterial ESG issues. They examined both value-weighted[9] (VW) and equal-weighted (EW) quintile and decile portfolios. Fig. 3 shows, as in Table 4 of the paper, the top minus bottom alpha magnitude for four portfolios: value-weighted quintiles (VW_Q) and deciles (VW_D); and equal-weighted quintiles (EW_Q) and deciles (EW_D).
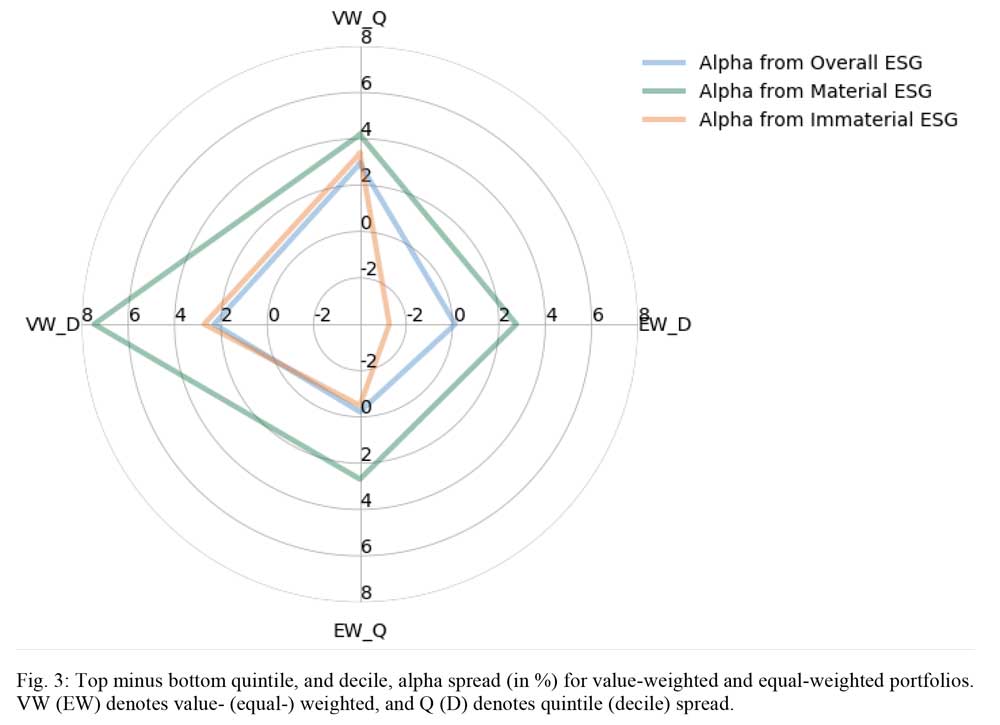
The alpha magnitude was largest when sorting based on firms’ material ESG performance. Sorting on firms’ overall (immaterial) ESG performance appears second (third) best. This suggests it is more useful for investors to evaluate firms’ ESG performance on material issues rather than on all or immaterial issues, and that incorporating materiality considerations improves the signal to noise ratio of firms’ ESG performance.
Fig. 3 also shows that the tile spread for value-weighted portfolios is higher than that for equal-weighted portfolios, suggesting stock prices of large firms impound the implications of high ESG performance to a greater extent than do the stock prices of smaller firms over the holding period examined (one year). One interpretation of this result is that, if ESG efforts represent intangible investments with uncertain payoff, investor uncertainty and dispersion of opinion about the payoff is potentially resolved earlier for larger firms than for smaller firms.
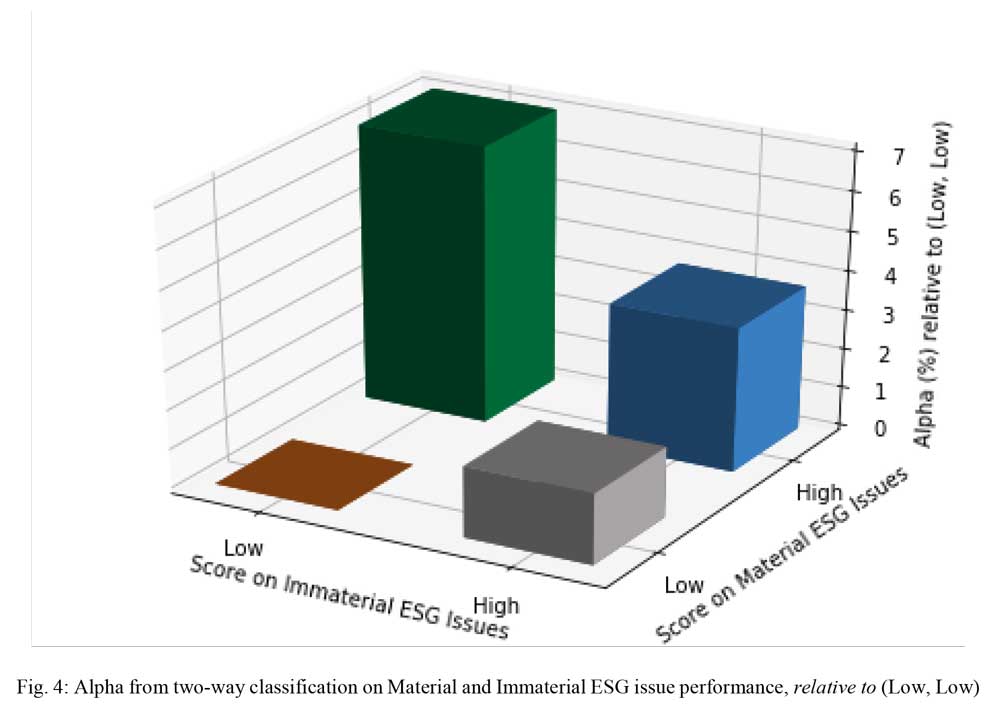
A second key result noted in the paper is alpha when both the material ESG score and the immaterial ESG score are jointly used to rank firms. Fig. 4 depicts the alpha relative to the portfolio of firms with low performance on both Material and Immaterial ESG issues (Low, Low). As the figure shows, firms with high Material ESG performance and low Immaterial ESG performance delivered the highest alpha, consistent with the idea that firms that discriminate between value-added (Material) ESG issues and non-value-added (Immaterial) ESG issues perform best.[10]
Finally, the authors also show that future growth in net income margin is significantly higher for firms with high material ESG performance from years two through five after portfolio construction. However, it is not significantly higher for firms with high immaterial ESG performance. This mirrors the result in the stock return space, and can mitigate potential concerns that the future returns might be driven by unfounded investor sentiment associated with ESG performance.
3. DISCUSSION
The relation between firms’ ESG efforts and alpha is of significant interest to investors. The authors presented new evidence that incorporating the materiality of issues in assessing firms’ ESG performance can yield alpha. In particular, their results indicate that firms with high performance on material ESG issues have higher average risk-adjusted returns than firms with low performance on material ESG issues. Sorting firms on their performance on immaterial ESG issues did not yield a meaningful return spread. Further, firms with high performance on material issues and low performance on immaterial issues performed best in a two-way sort, suggesting firms that effectively focus efforts on material issues have the highest potential for return outperformance.
The study described above had some data availability limitations – it was conducted on U.S. firms, using one ESG data source (KLD), and the sample covered six of ten sectors. Following that study, in-house tests by Causeway’s research team have also found some evidence that materiality matters in Emerging Markets samples that include all sectors, using MSCI data. One limitation in Causeway’s tests is that MSCI data is only available from 2013, so the available time series for tests is short. However, short time series generally bias against finding significant results, i.e., they sometimes lend a conservative bias to tests. Finding a significant effect of materiality with a shorter time series therefore appears encouraging.
This commentary should not be relied on as research or investment advice regarding any investment. These views are subject to change, and there is no guarantee that any forecasts made will come to pass. Forecasts are subject to numerous assumptions, risks and uncertainties, which change over time, and Causeway undertakes no duty to update any such forecasts. Information and data presented has been developed internally and/or obtained from sources believed to be reliable; however, Causeway does not guarantee the accuracy, adequacy or completeness of such information. Information about SASB is derived from public sources, and this commentary should not be relied on as a recommendation or endorsement of any particular data vendor. The reader should consult its own advisors before choosing a data vendor.
The paper described herein was prepared prior to Professor Khan’s employment with Causeway and the opinions and conclusions expressed do not necessarily reflect the views of Causeway.
MSCI has not approved, reviewed or produced this report, makes no express or implied warranties or representations and is not liable whatsoever for any data in the report. You may not redistribute the MSCI data or use it as a basis for other indices or investment products.
Appendix A: Illustrative Examples of Material ESG Issues by Industry
Appendix B: Research Design
A potential concern with testing any alpha signal is correlated omitted variables, or the concern that ESG might be correlated with some other factor, such as firm performance for example, that could cloud inferences relating to ESG. The authors sought to mitigate this concern in two ways. First, they examined changes in material and immaterial ESG performance seeking to effectively remove unobserved time-invariant firm effects. Second, they orthogonalized the change in ESG scores with respect to a host of firm characteristics within sector, yielding a residual score that was expected to be uncorrelated with these characteristics. The residual ESG score was used in portfolio construction.
The authors tested for return predictability using two research designs (the results from both designs were consistent). The first design, favored in the asset pricing literature, estimates Fama and French (1993)[11] calendar-time regressions of ESG portfolio returns on the market excess return, size and value factors, the Carhart (1997)[12] momentum factor, and the Pastor and Stambaugh (2003)[13] liquidity factor. The test variable is the alpha which represents the average return unexplained by exposure to risk factors.
The second design, traditionally favored in the corporate finance literature, estimates firm-level panel regressions of future returns in a model that is saturated with firm characteristics and industry and time fixed effects. The test variable is an indicator for firms with high material or immaterial ESG performance.
The authors also tested for future financial performance (profitability growth) associated with ESG performance, and conducted various robustness tests.
Endnotes
[1] Khan, Mozaffar, George Serafeim, and Aaron Yoon. 2016. Corporate sustainability: first evidence on materiality. The Accounting Review 91, 1697-1724.
[2] ESG momentum refers to the one-year change in firms’ ESG performance score. The calculation of this score is described in more detail in Section 1c, p.6.
[3] Kaplan, Robert, and David Norton. 1992. The Balanced Scorecard – measures that drive performance. Harvard Business Review (Jan/Feb).
[4] Edmans, Alex. 2011. Does the stock market fully value intangibles? Employee satisfaction and equity prices. Journal of Financial Economics 101, 621-640.
[5] Shleifer, Andrei, and Robert Vishny. 1997. A survey of corporate governance. Journal of Finance 52, 737-783.
[6] For the effect of poor disclosure and heterogeneity of beliefs on mispricing see, for example, Chen, Wen, Mozaffar Khan, Leonid Kogan, and George Serafeim. 2017. Cross-firm return predictability and accounting quality. Working paper, CUHK, Minnesota, MIT, and Harvard.
[7] For details on SASB’s methodology for identifying material ESG issues by industry please see https://www.sasb.org/approach/our-process/.
[8] Define N as the total number of evaluated ESG issues, 1Nx1 as a vector of ones, MNx1as an indicator vector for material ESG issues where 1 (0) indicates a material (immaterial) issue, SNx2 as a firm-level matrix of KLD scores with strength (concern) scores in the first (second) column, and A’ = [1, -1]. Then a firm’s total ESG score = 1’SA, its performance on material issues = M’SA, and its performance on immaterial issues = (1 – M)’SA.
[9] Market-cap weighted.
[10] In Table 7 of the authors’ paper, the magnitude of the alpha for (Low, Low) firms is -2.2%, for (High Immaterial, Low Material) is -0.38%, for (High, High) is 1.5%, and for (Low Immaterial, High Material) is 4.83%. The only statistically significant alpha is for the (Low Immaterial, High Material) portfolio.
[11] Fama, Eugene, and Kenneth French. 1993. Common risk factors in the returns on stocks and bonds. Journal of Financial Economics 33, 3-56.
[12] Carhart, Mark. 1997. On persistence in mutual fund performance. Journal of Finance52, 57-82.
[13] Pastor, Lubos, and Robert Stambaugh. 2003. Liquidity risk and expected stock returns. Journal of Political Economy 111, 642-685.