Contact Us
Subscribe to Causeway Insights, delivered to your inbox.
In early March, 130 of our clients, consultants, advisors, academics, and Causeway professionals gathered in Laguna Beach, California for our second biennial conference, Causeway Convergence: Dynamic Value. Against the backdrop of the magnificent Pacific Ocean, the Causeway research team analyzed the shifting tides of equity markets. Conference guests exchanged ideas on issues impacting their professions and their constituents. We looked ahead, as guest keynote speakers Barclays’ CEO Jes Staley, technology entrepreneur Peter Diamandis, and economist Austan Goolsbee articulated their visions for how current policies and innovation would interact to shape the coming years.
The need for innovation—even within the long tradition of value investing—inspired the conference theme: Dynamic Value. The concept underpinning value investing is simple: buy stocks the market has priced too low…and wait. But this general description masks the diverse environments that produce undervaluation, and what causes the gap between market and intrinsic values to close. The better we as investors understand—and can exploit—value’s complexities, the greater returns we can generate for our clients.
Last year’s equity market performance highlighted the dynamic nature of value investing. Despite a substantial June Brexit setback, 2016 ushered in a sharp rebound in the performance of value style investing. The value indices, with large concentrations in financial stocks, experienced the largest recovery over the calendar year, after having suffered significantly in prior years. Value recoveries have typically occurred quickly. “Timing” the value factor sounds good in theory, but success remains illusory in practice. What can active management deliver beyond the already attractive alpha (return in excess of the benchmark) stream from the value indices? How does Causeway define value, and what type of value do we offer our clients? To address the value cycle, Jamie Doyle, portfolio manager, and Ryan Myers, senior quantitative research analyst, scrutinized value’s behavior and presented their findings at our conference in The Hitchhiker’s Guide to the Value Cycle. In this newsletter, they share highlights of their analysis.
JD: For fans of Douglas Adams’ classic science fiction adventure, The Hitchhiker’s Guide to the Galaxy, I’ll start with the answer: “42”—then, we must find the question. It is difficult to dispute that value has outperformed growth over the past 25 years, measured as value indices relative to standard indices, or returns to value factors compared to returns to other systematic factors. However, there is still some ambiguity in value’s definition.
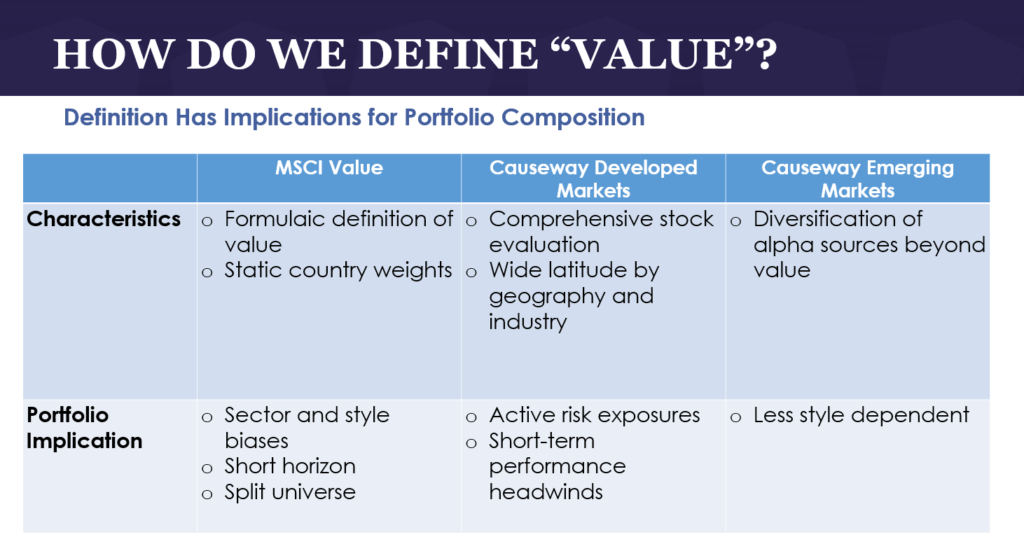
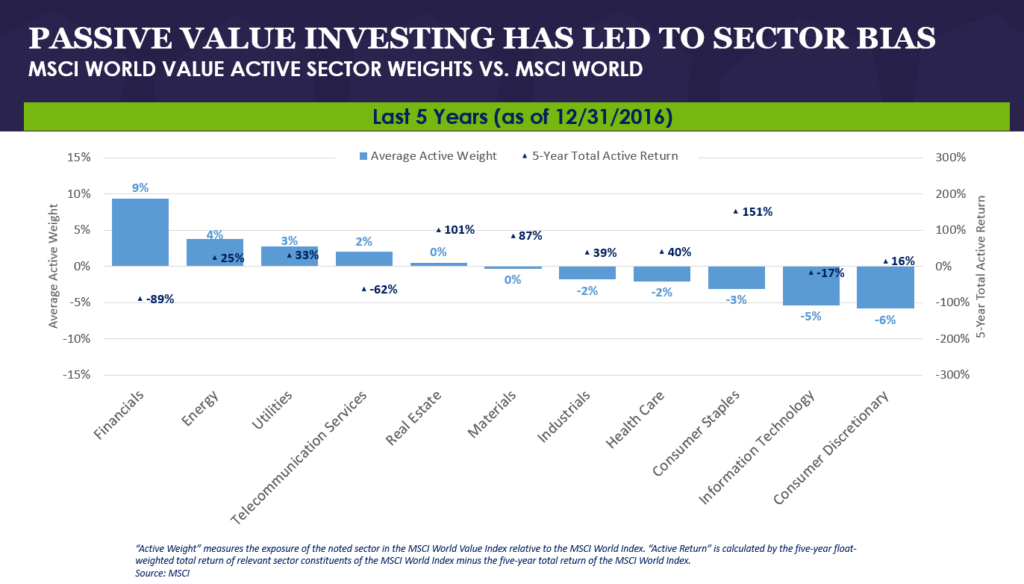
RM: We often get asked about value indices and their effectiveness. The formulaic definition of value by benchmarks has resulted in pronounced sector biases. For example, over 30% of the MSCI EAFE Value Index market capitalization is comprised of non-real estate financial stocks. Value indices have shorter investment horizons, as their metrics use current or next-twelve-months data. Furthermore, these indices assume that half of the investable universe consists of value stocks, an overly rigid construct made even more artificial by static country weights.
Causeway's bottom-up stock selection process is designed to result in dynamic style exposures to factors such as value, momentum, cyclicality, and even growth.
JD: These “risky” indices make investing in passive value somewhat problematic. We seek to construct value portfolios for clients that have less volatility and beta (sensitivity to the benchmark index) than the value indices, which have exhibited sector skew.
Our clients can get exposure to value factors cheaply, via smart beta strategies. However, they want more than just a general overweight to the value risk factor – and we believe we have delivered more since the inceptions of our value strategies. Causeway’s bottom-up stock selection process is designed to result in dynamic style exposures to factors such as value, momentum, cyclicality, and even growth.
As long and painful as value drawdowns can be, in many instances the recovery has rapidly reached new highs, rewarding the patient investor.
RM: Diversification of factor exposure is really important. Look, for example, at how crowded the “Quality/Defensive” segment of markets became by late 2015, while value attracted few buyers. The more crowded and concentrated the factor exposure, the greater the rebound when mean reversion begins.
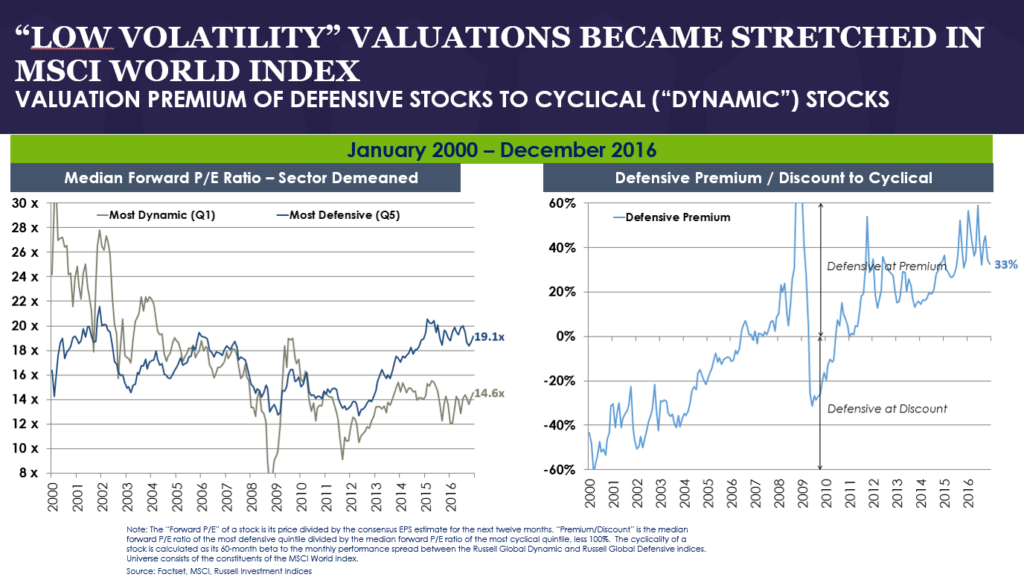
Those rebounds tend to occur very quickly, making it difficult to time the recovery. As long and painful as value drawdowns can be, in many instances the recovery has rapidly reached new highs, rewarding the patient investor.
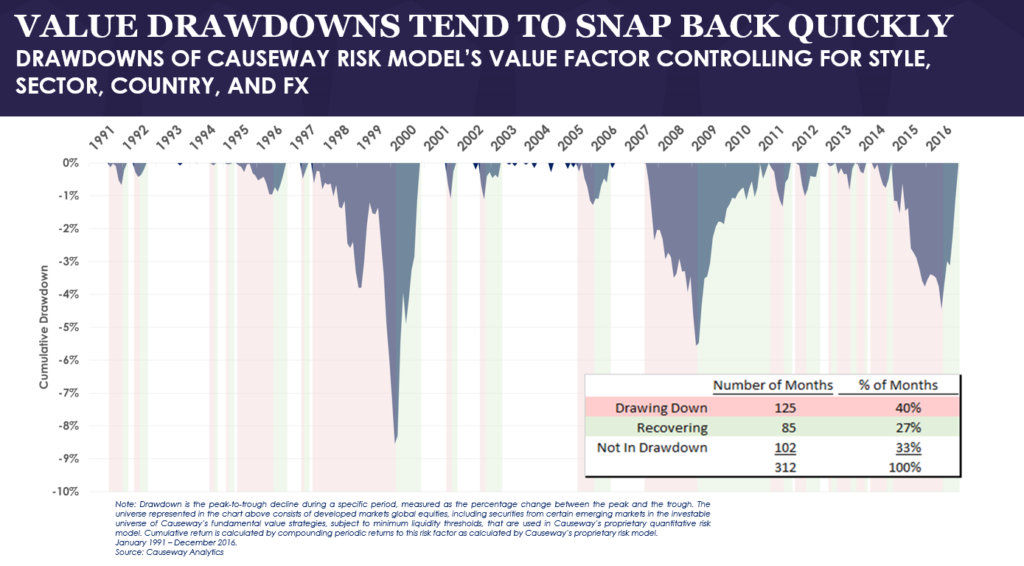
We attempt to smooth the value cycle by using our own quantitative tools such as earnings momentum, screening for financial strength, and short position monitoring.
JD: In Causeway’s Global and International value equity strategies, my colleagues and I expend significant time and effort evaluating all aspects of the investment case. We give ourselves wide latitude by geography and industry. Our process typically brings other active risk exposures to client portfolios. We attempt to smooth the value cycle by using our own quantitative tools such as earnings momentum, screening for financial strength, and short position monitoring. With this approach, stock selection, rather than style exposure, has been the primary driver of investment returns.
RM: For our emerging markets portfolios, we seek to diversify alpha sources beyond value, optimizing holdings around specific constraints. We combine value and growth factors, as well as bottom-up and top-down factors. Value factors typically have a low correlation with earnings growth and momentum factors, giving us several different avenues to potentially realize alpha.
JD: Value has worked over full market cycles. Yet we know that many asset owners and asset managers simply do not have the ability to bear the drawdowns associated with value investing. By combining fundamental with quantitative tools, we aim to diversify factor exposure, emphasize value during its most unpopular periods, and position client portfolios for rebounds. We believe our approach should convince even the most transient of value hitchhikers to settle in for the ride.
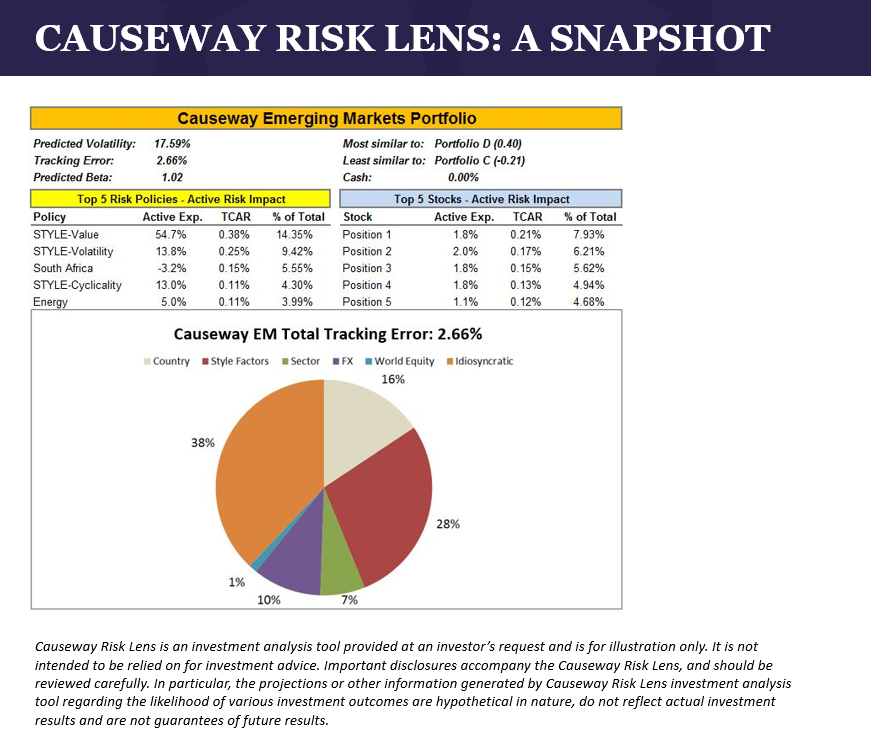
Breakout Session Spotlight: Causeway Risk Lens
Conference participants in the Causeway Risk Lens breakout session learned how this Causeway Analytics tool can deepen their understanding of individual managers and a combined multi-manager portfolio. Analyzing user-submitted mutual funds, analysts Seung Han and Ryan Myers demonstrated how the Risk Lens exposes current risk positioning, anticipates investment outcomes under specific market regimes, and determines if a manager’s style exposures are “true to label.” They debuted new enhancements to the tool, including an analysis of Environmental, Social and Governmental, or “ESG”, exposures and an examination of funds’ vulnerabilities in various scenarios, such as a rising interest rate environment.
Access to Conference Content
Our 2017 conference, Causeway Convergence: Dynamic Value, emphasized quantitative and fundamental synergies in the investment process. We evaluated the equity risk premium in a low interest rate environment, examined the increasing dominance of Asia in emerging markets, and explored new innovations in ESG investing, among other topics.
For those of you who were unable to attend the event, we would gladly share our conference content with you. Please contact your Causeway representative, or email [email protected] to request our research.
Important Disclosures
This market commentary expresses Causeway’s views as of April 7, 2017 and should not be relied on as research or investment advice regarding any investment. These views and any portfolio holdings and characteristics are subject to change, and there is no guarantee that any forecasts made will come to pass. Forecasts are subject to numerous assumptions, risks and uncertainties, which change over time, and Causeway undertakes no duty to update any such forecasts. Information and data presented has been developed internally and/or obtained from sources believed to be reliable; however, Causeway does not guarantee the accuracy, adequacy or completeness of such information.
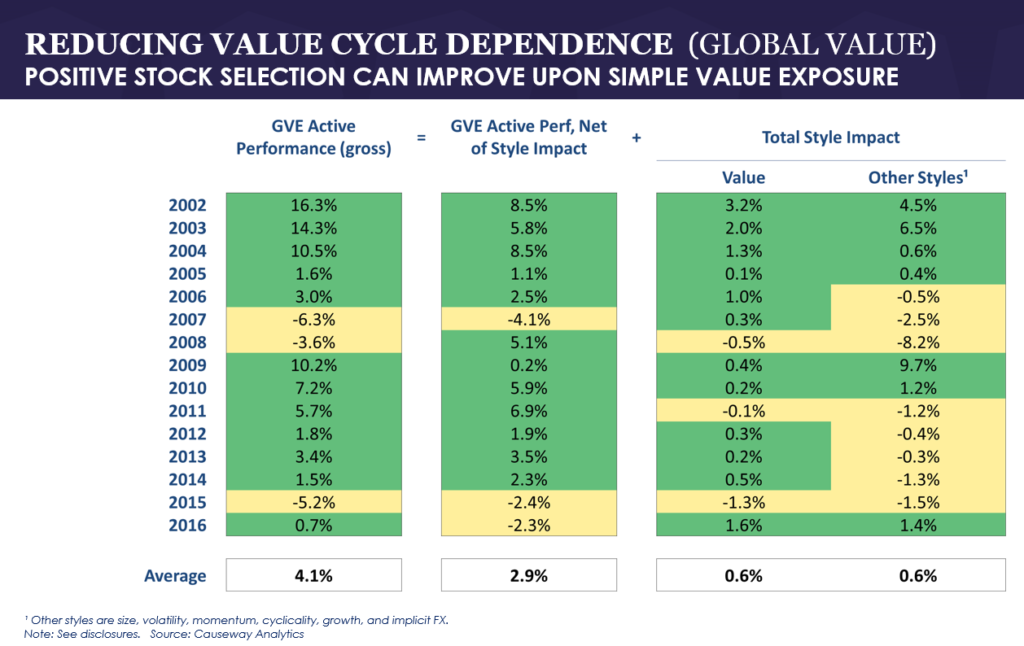
Weighted average calendar year factor returns represent the product of the factor’s universe-wide return and that factor’s active weight in the Causeway Global Value Equity Composite (relative to the MSCI World Index). Each factor’s universe-wide return is based on data from FactSet Lionshares and/or Bloomberg and reflects the universe of developed markets international equity securities, including securities from other countries in a Composite’s investable universe, subject to minimum liquidity thresholds. Each factor’s universe-wide return is derived from Causeway’s proprietary risk model which, using monthly regressions of a broad universe of international equities, seeks to isolate the returns attributable to each style from returns attributable to countries, sectors, currencies, and idiosyncratic factors.
“Value” is a measure of a stock’s relative cheapness, “Size” is a measure of relative market values, “Volatility” is a measure of a stock’s historical variability, “Momentum” is a measure of a stock’s relative price performance, “Cyclicality” is a measure of a stock’s sensitivity to market cycles, “Growth” is a measure of the historical growth in a stock’s income statement metrics, and “Implicit FX” is a measure of a stock’s sensitivity to changing exchange rates versus the U.S. dollar.
“Total Style Impact” represents the sum of the weighted average style returns for the Composite portfolio. “GVE Active Performance” represents the performance of the Composite portfolio, gross of fees, relative to the MSCI World Index. “GVE Active Perf, Net of Style Impact” represents the “GVE Active Performance” minus the “Total Style Impact” and is intended to show the Composite portfolio’s style-neutralized relative performance.
The CCM Risk Factor Performance Impact is not intended to be relied on for investment advice. Past performance is not a guarantee of future results.
The MSCI EAFE Index is a free float‐adjusted market capitalization index that is designed to measure the equity market performance of developed markets, excluding the US & Canada. The MSCI World Index is a free float-adjusted market capitalization index, designed to measure developed market equity performance, consisting of 23 developed country indices, including the U.S. The MSCI EAFE Value Index and MSCI World Value Index are subsets of these indices, and target 50% coverage of the MSCI EAFE Index or MSCI World Index, respectively, with value investment style characteristics for index construction using three variables: book value to price, 12-month forward earnings to price, and dividend yield. The Indices are gross of withholding taxes, assume reinvestment of dividends and capital gains, and assume no management, custody, transaction or other expenses. It is not possible to invest directly in an index.
MSCI has not approved, reviewed or produced this report, makes no express or implied warranties or representations and is not liable whatsoever for any data in the report. You may not redistribute the MSCI data or use it as a basis for other indices or investment products.
The Firm, Causeway Capital Management LLC (“Causeway”), is organized as a Delaware limited liability company and began operations in June 2001. It is registered as an investment adviser with the U.S. Securities and Exchange Commission under the Investment Advisers Act of 1940. Causeway manages international, global, and emerging markets equity assets for corporations, pension plans, public retirement plans, sovereign wealth funds, superannuation funds, Taft-Hartley pension plans, endowments and foundations, mutual funds and other collective investment vehicles, charities, private trusts and funds, wrap fee programs, and other institutions. The firm includes all discretionary and non-discretionary accounts managed by Causeway.
Causeway claims compliance with the Global Investment Performance Standards (GIPS®).
The Global Value Equity Composite (“Global Composite”) includes all U.S. dollar denominated, discretionary accounts in the global value equity strategy which are not constrained by socially responsible investment restrictions. Through March 30, 2007, Causeway managed the Global Composite using research and recommendations regarding U.S. value stocks from an unaffiliated investment advisory firm under a research services agreement for an asset-based fee. The global value equity strategy seeks long-term growth of capital and income through investment primarily in equity securities of companies in developed countries located outside the U.S. and of companies located in the U.S. The benchmark is the MSCI World Index.
New accounts are included in the Composite after the first full month under management. Terminated accounts are included in the Composite through the last full month under management. Account returns are calculated daily. Monthly account returns are calculated by geometrically linking the daily returns. The returns of the Composite are calculated monthly by weighting monthly account returns by the beginning market values. Valuations and returns are computed and stated in U.S. dollars. Returns include the reinvestment of interest, dividends, and any capital gains. Returns are calculated gross of withholding taxes on dividends, interest income, and capital gains, except returns of Causeway-sponsored mutual funds are net of such withholding taxes and reflect accrued tax treaty reclaims. The firm’s policies for valuing portfolios, calculating performance, and comparing compliant presentations are available upon request. Gross-of-fees returns are presented before management, performance-based and custody fees, but after trading expenses. Net-of-fees returns are presented after the deduction of actual management fees, performance-based fees and all trading expenses, but before custody fees. Causeway’s basic management fee schedules are described in its firm brochure pursuant to Part 2 of Form ADV.
Past performance is no guarantee of future performance. In addition to the normal risks associated with investing, international investments may involve risk of capital loss from unfavorable fluctuation in currency values, from differences in generally accepted accounting principles or from economic or political instability in other nations.
Contact Sarah Van Ness at 310-231-6127 or [email protected] to request a complete list and description of firm composites and/or a presentation that adheres to the GIPS® standards.